I already covered some inner-loop optimization tricks for low-level Rust code in mtpng, but how do you check how fast bits of your code are anyway?
It’s fairly easy to wrap your whole code in a timer, which I’ve done for convenience of testing total runtime:
extern crate time;
use time::precise_time_s;

...

let start_time = precise_time_s();
write_png(&outfile, header, options, &pool, &data)?;
let delta = precise_time_s() - start_time;

println!("Done in {} ms", (delta * 1000.0).round());
(High-level benchmarks like this are supported in nightly/unstable Rust via “cargo bench”, or in stable with some additional tools.)
It’s a pain in the butt to do that kind of testing on all your inner functions though, and taking the timings affects your performance so you really shouldn’t try!
The way to go is to use a sampling-based profiler native to your operating system. I’ve done most of my detailed profiling on Linux, using the “perf” tool.
Build preparation
Currently the “cargo” package manager doesn’t support a profiling-specific … profile … for building. You need debug symbols or you won’t understand much of your profile details, but you need a fully optimized build or why bother measuring its performance?
It’s fairly easy to add debug info to your release builds in your Cargo.toml file:
[profile.release]
# Unoptimized debug builds are too slow to profile
# having debug info doesn't hurt perf for now
debug = true
Though you might want to remove it before making binary releases. :)
Alternatively you could remove all the things that slow down performance from the debug profile and add optimization to it.
Perf is good
Perf seems to have come from Linux kernel-land, and has all kinds of magical abilities of system-wide profiling I haven’t even fathomed yet. But it’s fairly easy to use for quick and dirty profiling!
Run your program with “perf record” plus your command line; I usually go ahead and run via “cargo run” and then skip through the cargo invocation so I don’t have to go finding the binary under targets/release/bin or whereever.
$ perf record cargo run --release -- in.png out.png --threads=1(Using a single worker thread makes it easier to read the profile, though sometimes you want to go crazy and test with all threads. Perf will happily record all the threads and child processes!)
If you have a long-running process you want to attach to at runtime, you can do that with the -p option and the pid:
$ perf record -p 12345This causes a very slight slowdown to your program as it records, but it’s consistent over time and can measure hotspots down to the instructions!
Reporting for duty
Once you’ve run the program, pull up an interactive report in your terminal with “perf report”:
$ perf reportYou can also save multiple recordings and pick up a past one, if you want to compare multiple runs of versions of your program.
The initial view will be of the entire run: all processes, all threads, every symbol in it. (You won’t see symbols for system libraries unless you’ve installed debug info packages.)
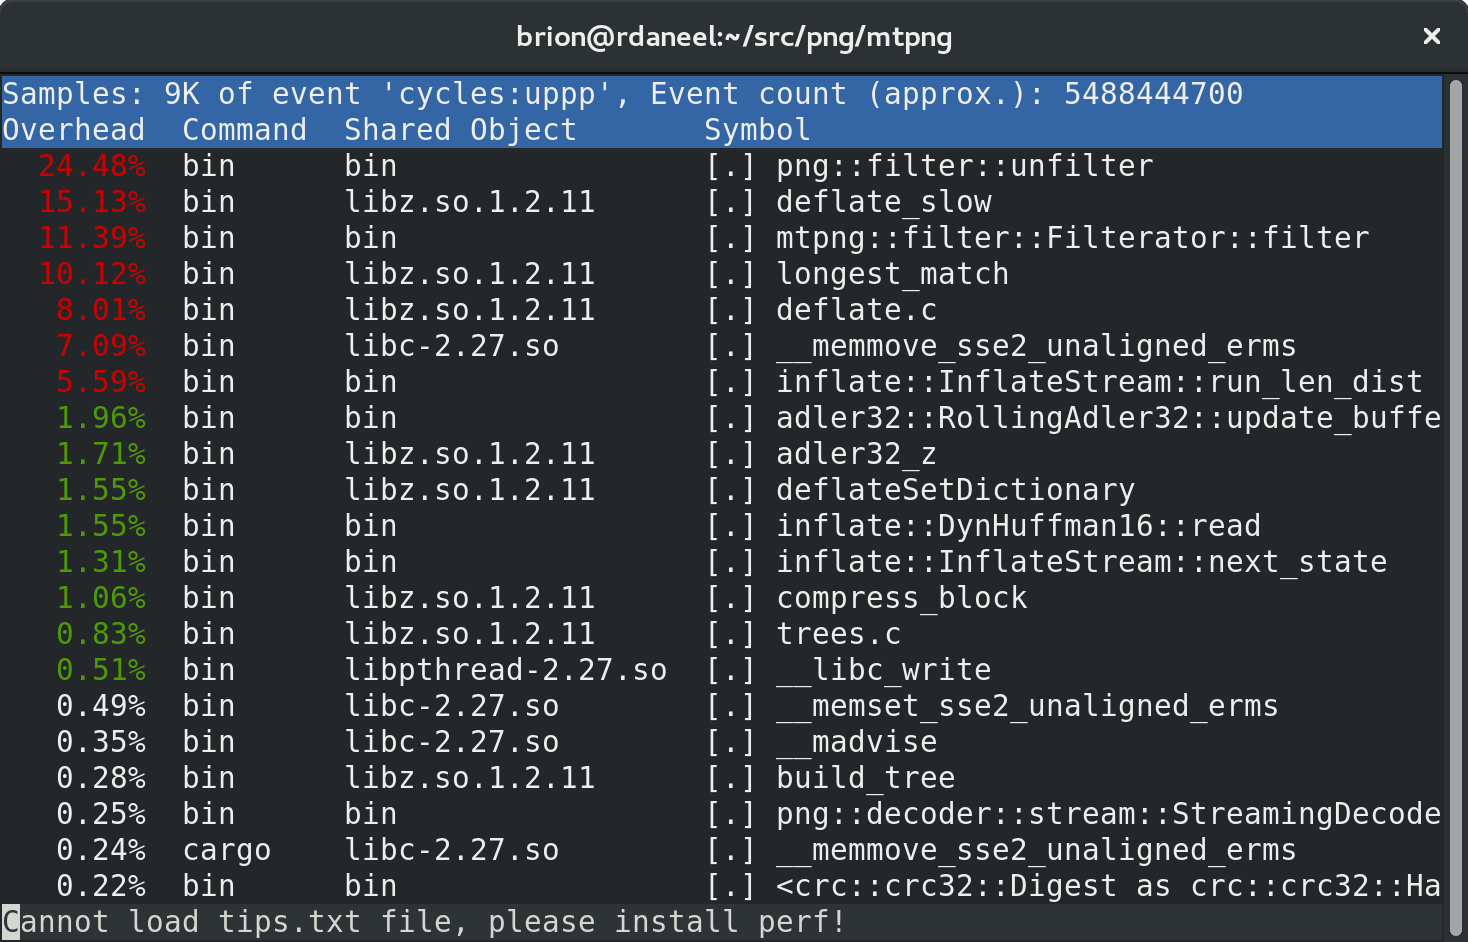
That “Cannot load tips.txt file” seems to be a packaging problem with perf in Fedora. :) It’s harmless.
Use the arrow keys to pick an item of interest — in this case mtpng::filter::Filterator::filter — and hit enter to get a menu:
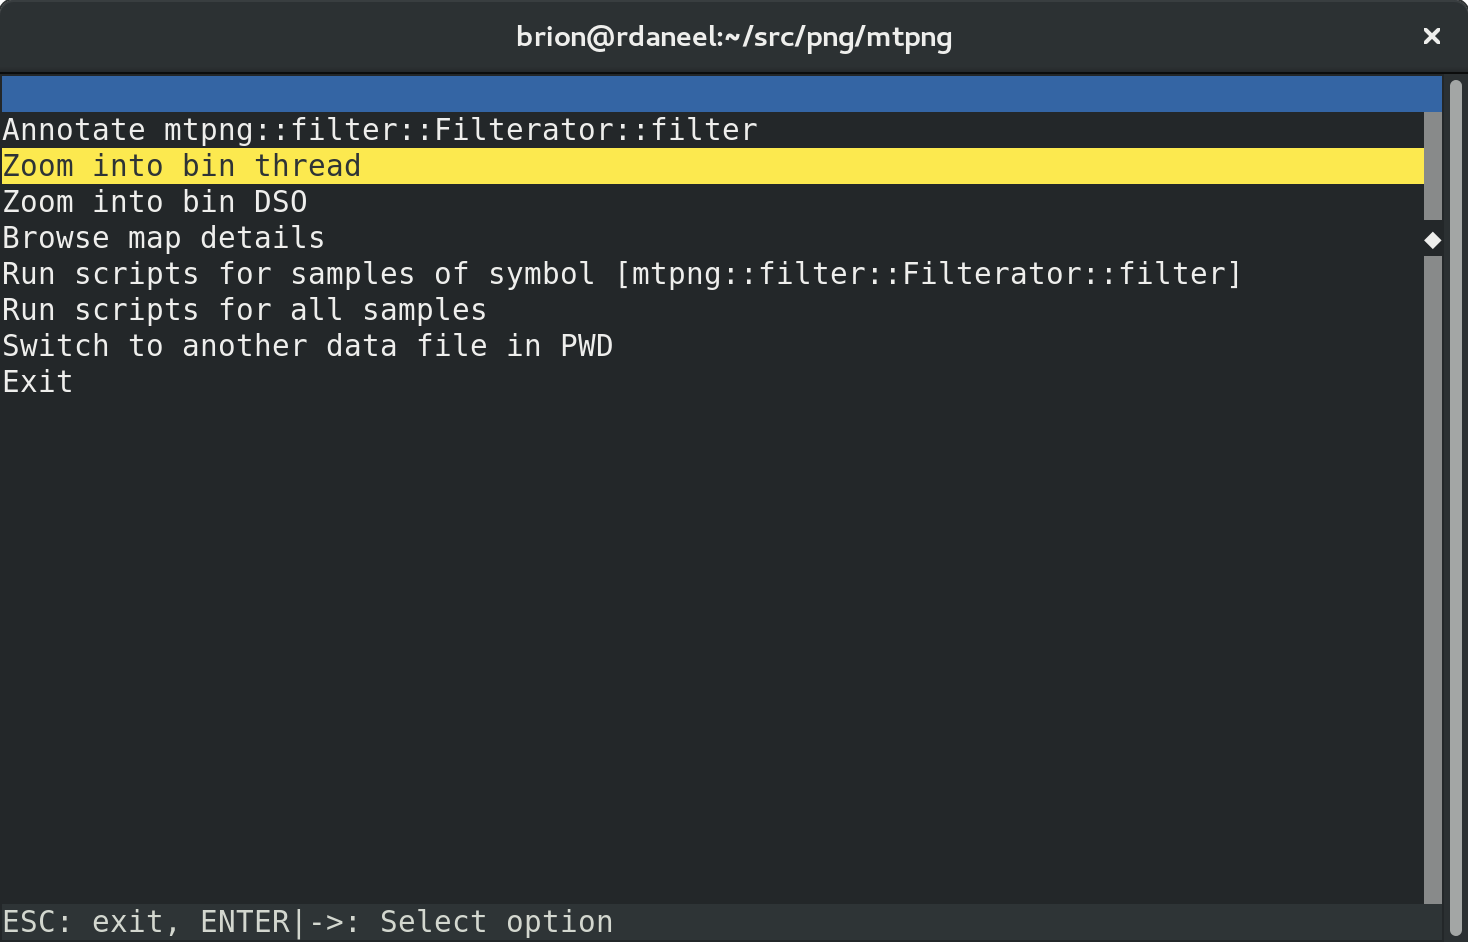
“bin” is the name of my binary (clever), so let’s first dive into the relevant worker thread from my process, and ignore the rest:
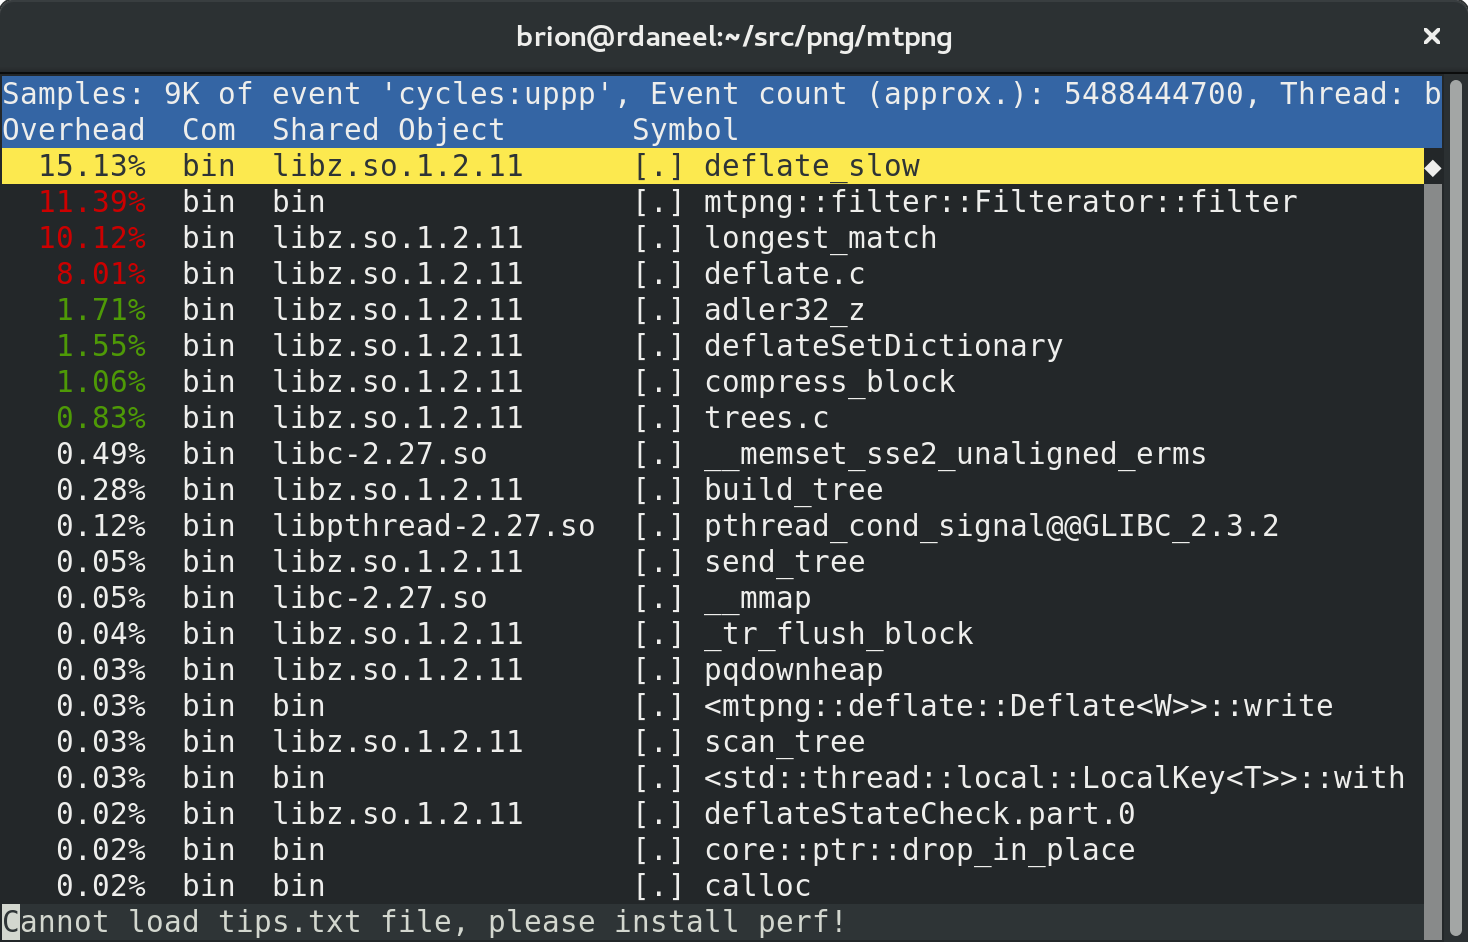
Now we can see that the biggest individual time cost in the worker thread pool is libz’s “deflate” compression! This is only because we’re seeing the profile after a few days of optimization. Before, the biggest was the filter call. :D
Let’s scroll down and hit enter to look at the filter function in detail:
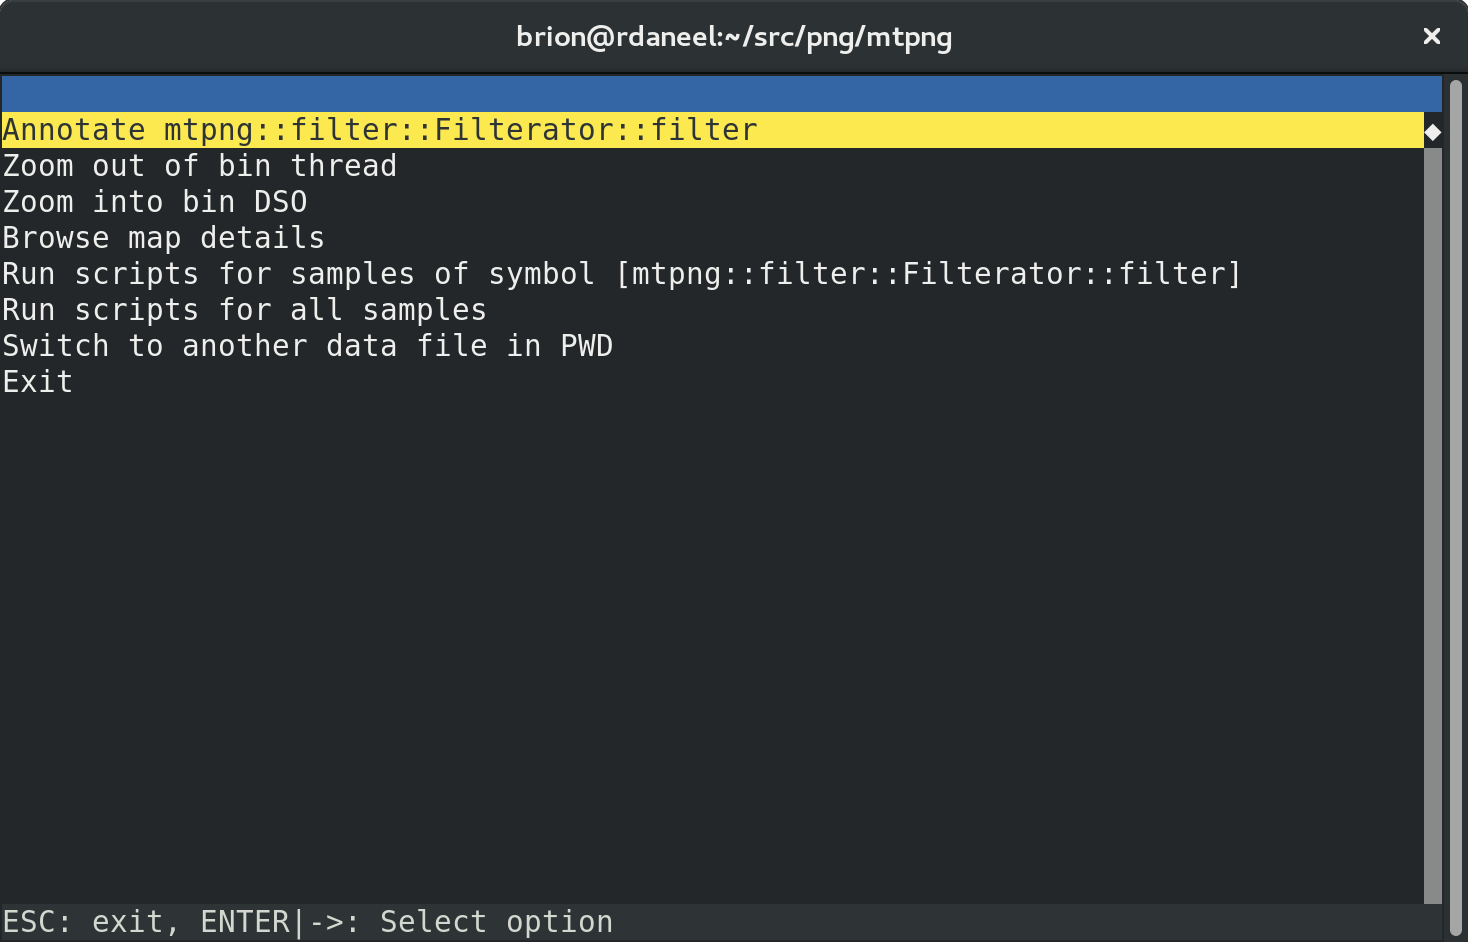
Hit “Annotate” and the real fun starts:
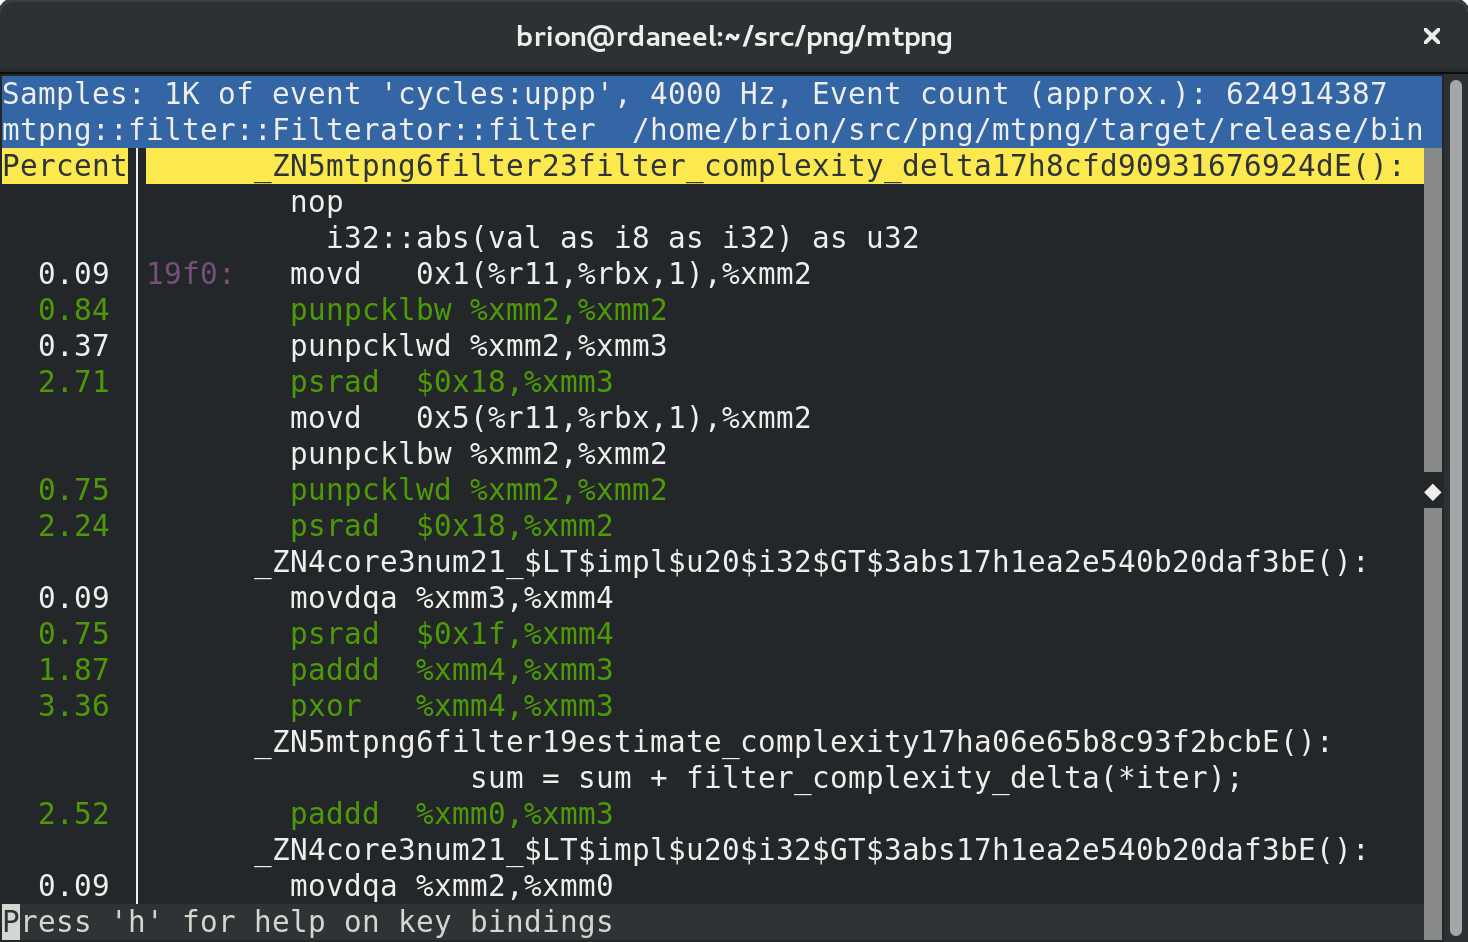
It’ll pop you into what it thinks is the biggest hotspot, but in a big function you might have to scroll around to find the relevant stuff.
You’ll notice both the instruction-by-instruction disassembly gibberish (useful but tricky to understand!) and little bits of your original source and (mangled) symbol declarations.
In heavily optimized Rust code it can be hard to follow exactly what’s going on because things get re-ordered and there can be magic under the hood you didn’t realize were happening… but it can be enough to piece together which individual parts of your function are slow, and to see which bits are different when you change something.
In this case we can see that the filter complexity heuristic loop has been auto-vectorized to use SSE instructions, even though my source code is a regular call in an iterator loop. Pretty rad!
Next post: using Rust macros to specialize functions for fun and performance!