Parallelizing PNG, part 9: writing a C API in Rust

In my last posts I explored some optimization strategies inside the Rust code for mtpng, a multithreaded PNG encoder I’m creating. Now that it’s fast, and the remaining features are small enough to pick up later, let’s start working on a C API so the library can be used by C/C++-based apps.

If you search the web you’ll find a number of tutorials on the actual FFI-level interactions, so I’ll just cover a few basics and things that stood out. The real trick is in making a good build system; currently Rust’s “Cargo” doesn’t interact well with Meson, for instance, which really wants to build everything out-of-tree. I haven’t even dared touch autoconf. ;)

For now, I’m using a bare Makefile for Unix (Linux/macOS) and a batch file for Windows (ugh!) to drive the building of a C-API-exercising test program. But let’s start with the headers and FFI code!

Contracts first: make a header file

The C header file (“mtpng.h“) defines the types, constants, and functions available to users of the library. It defines the API contract, both in code and in textual comments because you can’t express things like lifetimes in C code. :)

Enums

Simple enums (“fieldless enums” as they’re called) can be mapped to C enums fairly easily, but be warned the representation may not be compatible. C enums usually (is that the spec or just usually??) map to the C ‘int’ type, which on the Rust side is known as c_int. (Clever!)

//
// Color types for mtpng_encoder_set_color().
//
typedef enum mtpng_color_t {
    MTPNG_COLOR_GREYSCALE = 0,
    MTPNG_COLOR_TRUECOLOR = 2,
    MTPNG_COLOR_INDEXED_COLOR = 3,
    MTPNG_COLOR_GREYSCALE_ALPHA = 4,
    MTPNG_COLOR_TRUECOLOR_ALPHA = 6
} mtpng_color;

So the representation is not memory-compatible with the Rust version, which explicitly specifies to fit in a byte:

#[derive(Copy, Clone)]
#[repr(u8)]
pub enum ColorType {
    Greyscale = 0,
    Truecolor = 2,
    IndexedColor = 3,
    GreyscaleAlpha = 4,
    TruecolorAlpha = 6,
}

If you really need to ship the enums around bit-identical, use #[repr(c_int)]. Note also that there’s no enforcement that enum values transferred over the FFI boundary will have valid values! So always use a checked transfer function on input like this:

impl ColorType {
    pub fn from_u8(val: u8) -> io::Result<ColorType> {
        return match val {
            0 => Ok(ColorType::Greyscale),
            2 => Ok(ColorType::Truecolor),
            3 => Ok(ColorType::IndexedColor),
            4 => Ok(ColorType::GreyscaleAlpha),
            6 => Ok(ColorType::TruecolorAlpha),
            _ => Err(other("Invalid color type value")),
        }
}

More complex enums can contain fields, and things get complex. For my case I found it simplest to map some of my mode-selection enums into a shared namespace, where the “Adaptive” value maps to something that doesn’t fit in a byte and so could not be valid, and the “Fixed” values map to their contained byte values:

#[derive(Copy, Clone)]
pub enum Mode<T> {
    Adaptive,
    Fixed(T),
}

#[repr(u8)]
#[derive(Copy, Clone)]
pub enum Filter {
    None = 0,
    Sub = 1,
    Up = 2,
    Average = 3,
    Paeth = 4,
}

maps to C:

typedef enum mtpng_filter_t {
    MTPNG_FILTER_ADAPTIVE = -1,
    MTPNG_FILTER_NONE = 0,
    MTPNG_FILTER_SUB = 1,
    MTPNG_FILTER_UP = 2,
    MTPNG_FILTER_AVERAGE = 3,
    MTPNG_FILTER_PAETH = 4
} mtpng_filter;

And the FFI wrapper function that takes it maps them to appropriate Rust values.

Callbacks and function pointers

The API for mtpng uses a few callbacks, required for handling output data and optionally as a driver for input data. In Rust, these are handled using the Write and Read traits, and the encoder functions are even generic over them to avoid having to make virtual function calls.

In C, the traditional convention is followed of passing function pointers and a void* as “user data” (which may be NULL, or a pointer to a private state structure, or whatever floats your boat).

In the C header file, the callback types are defined for reference and so they can be validated as parameters:

typedef size_t (*mtpng_read_func)(void* user_data,
                                  uint8_t* p_bytes,
								  size_t len);

typedef size_t (*mtpng_write_func)(void* user_data,
                                   const uint8_t* p_bytes,
                                   size_t len);

typedef bool (*mtpng_flush_func)(void* user_data);

On the Rust side we must define them as well:

pub type CReadFunc = unsafe extern "C"
    fn(*const c_void, *mut uint8_t, size_t) -> size_t;

pub type CWriteFunc = unsafe extern "C"
    fn(*const c_void, *const uint8_t, size_t) -> size_t;

pub type CFlushFunc = unsafe extern "C"
    fn(*const c_void) -> bool;

Note that the function types are defined as unsafe (so must be called from within an unsafe { … } block or another unsafe function), and extern “C” which defines them as using the platform C ABI. Otherwise the function defs are pretty standard, though they use C-specific types from the libc crate.

Note it’s really important to use the proper C types because different platforms may have different sizes of things. Not only do you have the 32/64-bit split, but 64-bit Windows has a different c_long type (32 bits) than 64-bit Linux or macOS (64 bits)! This way if there’s any surprises, the compiler will catch it when you build.

Let’s look at a function that takes one of those callbacks:

extern mtpng_result
mtpng_encoder_write_image(mtpng_encoder* p_encoder,
                          mtpng_read_func read_func,
						  void* user_data);
#[no_mangle]
pub unsafe extern "C"
fn mtpng_encoder_write_image(p_encoder: PEncoder,
                             read_func: Option<CReadFunc>,
                             user_data: *const c_void)
-> CResult
{
    if p_encoder.is_null() {
        CResult::Err
    } else {
        match read_func {
            Some(rf) => {
                let mut reader = CReader::new(rf, user_data);
                match (*p_encoder).write_image(&mut reader) {
                    Ok(()) => CResult::Ok,
                    Err(_) => CResult::Err,
                }
            },
            _ => {
                CResult::Err
            }
        }
    }
}

Note that in addition to the unsafe extern “C” we saw on the function pointer definitions, the exported function also needs to use #[no_mangle]. This marks it as using a C-compatible function name, otherwise the C linker won’t find it by name! (If it’s an internal function you want to pass by reference to C, but not expose as a symbol, then you don’t need that.)

Notice that we took an Option<CReadFunc> as a parameter value, not just a CReadFunc. This is needed so we can check for NULL input values, which map to None. while valid values map to Some(CReadFunc). (The actual pointer to the struct is more easily checked for NULL, since that’s inherent to pointers.)

The actual function is passed into a CReader, a struct that implements the Read trait by calling the function pointer:

pub struct CReader {
    read_func: CReadFunc,
    user_data: *const c_void,
}

impl CReader {
    fn new(read_func: CReadFunc,
           user_data: *const c_void)
    -> CReader
    {
        CReader {
            read_func: read_func,
            user_data: user_data,
        }
    }
}

impl Read for CReader {
    fn read(&mut self, buf: &mut [u8]) -> io::Result<usize> {
        let ret = unsafe {
            (self.read_func)(self.user_data,
                             &mut buf[0],
                             buf.len())
        };
        if ret == buf.len() {
            Ok(ret)
        } else {
            Err(other("mtpng read callback returned failure"))
        }
    }
}

Opaque structs

Since I’m not exposing any structs with public fields, I’ve got a couple of “opaque struct” types on the C side which are used to handle pointing at the Rust structs from C. Not a lot of fancy-pants work is needed to marshal them; the pointers on the C side pass directly to pointers on the Rust side and vice versa.

typedef struct mtpng_threadpool_struct
    mtpng_threadpool;

typedef struct mtpng_encoder_struct
    mtpng_encoder;

One downside of opaque structs on the C side is that you cannot allocate them on the stack, because the compiler doesn’t know how big they are — so we must allocate them on the heap and explicitly release them.

In Rust, it’s conventional to give structs an associated “new” method, and/or wrap them in a builder pattern to set up options. Here I wrapped Rayon’s ThreadPool builder with a single function that takes a number of threads, boxes it up on the heap, and returns a pointer to the heap object:

extern mtpng_result
mtpng_threadpool_new(mtpng_threadpool** pp_pool,
                     size_t threads);
pub type PThreadPool = *mut ThreadPool;

#[no_mangle]
pub unsafe extern "C"
fn mtpng_threadpool_new(pp_pool: *mut PThreadPool,
	                    threads: size_t)
-> CResult
{
    if pp_pool.is_null() {
        CResult::Err
    } else {
        match ThreadPoolBuilder::new().num_threads(threads).build() {
            Ok(pool) => {
                *pp_pool = Box::into_raw(Box::new(pool));
                CResult::Ok
            },
            Err(_err) => {
                CResult::Err
            }
        }
    }
}

The real magic here is Box::into_raw() which replaces the Box<ThreadPool> smart pointer with a raw pointer you can pass to C. This means there’s no longer any smart management or releasing, so it’ll outlive the function… and we need an explicit release function:

extern mtpng_result
mtpng_threadpool_release(mtpng_threadpool** pp_pool);
#[no_mangle]
pub unsafe extern "C"
fn mtpng_threadpool_release(pp_pool: *mut PThreadPool)
-> CResult
{
    if pp_pool.is_null() {
        CResult::Err
    } else {
        drop(Box::from_raw(*pp_pool));
        *pp_pool = ptr::null_mut();
        CResult::Ok
    }
}

Box::from_raw() turns the pointer back into a Box<ThreadPool>, which de-allocates the ThreadPool at the end of function scope.

Lifetimes

Annotating object lifetimes in this situation is ….. confusing? I’m not sure I did it right at all. The only lifetime marker I currently use is the for thread pool, which must live at least as long as the encoder struct.

As a horrible hack I’ve defined the CEncoder to use static lifetime for the threadpool, which seems …. horribly wrong. I probably don’t need to do it like this. (Guidance and hints welcome! I will update the post and the code! :D)

// Cheat on the lifetimes?
type CEncoder = Encoder<'static, CWriter>;

Then the encoder creation, which takes an optional ThreadPool pointer and required callback function pointers, looks like:

extern mtpng_result
mtpng_encoder_new(mtpng_encoder** pp_encoder,
                  mtpng_write_func write_func,
                  mtpng_flush_func flush_func,
                  void* const user_data,
                  mtpng_threadpool* p_pool);
pub type PEncoder = *mut CEncoder;

#[no_mangle]
pub unsafe extern "C"
fn mtpng_encoder_new(pp_encoder: *mut PEncoder,
                     write_func: Option<CWriteFunc>,
                     flush_func: Option<CFlushFunc>,
                     user_data: *const c_void,
                     p_pool: PThreadPool)
-> CResult
{
    if pp_encoder.is_null() {
        CResult::Err
    } else {
        match (write_func, flush_func) {
            (Some(wf), Some(ff)) => {
                let writer = CWriter::new(wf, ff, user_data);
                if p_pool.is_null() {
                    let encoder = Encoder::new(writer);
                    *pp_encoder = Box::into_raw(Box::new(encoder));
                    CResult::Ok
                } else {
                    let encoder = Encoder::with_thread_pool(writer, &*p_pool);
                    *pp_encoder = Box::into_raw(Box::new(encoder));
                    CResult::Ok
                }
            },
            _ => {
                CResult::Err
            }
        }
    }
}

Note how we take the p_pool pointer and turn it into a Rust reference by dereferencing the pointer (*) and then re-referencing it (&). :)

Because we’re passing the thread pool across a safe/unsafe boundary, it’s entirely the caller’s responsibility to uphold the compiler’s traditional guarantee that the pool instance outlives the encoder. There’s literally nothing to stop it from being released early by C code.

Calling from C

Pretty much all the external-facing functions return a a result status enum type, which I’ve mapped the Rust Result<_,Error(_)> system into. For now it’s just ok or error states, but will later add more detailed error codes:

Since C doesn’t have a convenient “?” syntax or try! macro for trapping those, I wrote a manual TRY macro for my samples’s main(). Ick!

#define TRY(ret) { \
    mtpng_result _ret = (ret); \
    if (_ret != MTPNG_RESULT_OK) { \
        fprintf(stderr, "Error: %d\n", (int)(_ret)); \
        retval = 1; \
        goto cleanup; \
    }\
}

The calls are then wrapped to check for errors:

int main() {

... some state setup ...

	mtpng_threadpool* pool;
    TRY(mtpng_threadpool_new(&pool, threads));

    mtpng_encoder* encoder;
    TRY(mtpng_encoder_new(&encoder,
                          write_func,
                          flush_func,
                          (void*)&state,
                          pool));

    TRY(mtpng_encoder_set_chunk_size(encoder, 200000));

    TRY(mtpng_encoder_set_size(encoder, 1024, 768));
    TRY(mtpng_encoder_set_color(encoder, color_type, depth));
    TRY(mtpng_encoder_set_filter(encoder, MTPNG_FILTER_ADAPTIVE));

    TRY(mtpng_encoder_write_header(encoder));
    TRY(mtpng_encoder_write_image(encoder, read_func, (void*)&state));
    TRY(mtpng_encoder_finish(&encoder));

cleanup:
    if (encoder) {
        TRY(mtpng_encoder_release(&encoder));
    }
    if (pool) {
        TRY(mtpng_threadpool_release(&pool));
    }

    printf("goodbye\n");
    return retval;
}

Ok, mostly straightforward right? And if you don’t like the TRY macro you can check error returns manually, or whatever. Just don’t forget to check them! :D

Error state recovery other than at API boundary checks may or may not be very good right now, I’ll clean that up later.

Now I’m pretty sure some things will still explode if I lean the wrong way on this system. For instance looking above, I’m not convinced that the pointers on the stack will be initialized to NULL except on debug builds. :D

Don’t forget the callbacks

Oh right, we needed read and write callbacks! Let’s put those back in. Start with a state structure we can use (it doesn’t have to be the same state struct for both read and write, but it is here cause why not?)

typedef struct main_state_t {
    FILE* out;
    size_t width;
    size_t bpp;
    size_t stride;
    size_t y;
} main_state;

static size_t read_func(void* user_data,
	                    uint8_t* bytes,
	                    size_t len)
{
    main_state* state = (main_state*)user_data;
    for (size_t x = 0; x < state->width; x++) {
        size_t i = x * state->bpp;
        bytes[i] = (x + state->y) % 256;
        bytes[i + 1] = (2 * x + state->y) % 256;
        bytes[i + 2] = (x + 2 * state->y) % 256;
    }
    state->y++;
    return len;
}

static size_t write_func(void* user_data,
	                     const uint8_t* bytes,
	                     size_t len)
{
    main_state* state = (main_state*)user_data;
    return fwrite(bytes, 1, len, state->out);
}

static bool flush_func(void* user_data)
{
    main_state* state = (main_state*)user_data;
    if (fflush(state->out) == 0) {
        return true;
    } else {
        return false;
    }
}

Couple of things stand out to me: first, this is a bit verbose for some common cases.

If you’re generating input row by row like in this example, or reading it from another source of data, the read callback works ok though you have to set up some state. If you already have it in a buffer, it’s a lot of extra hoops. I’ve added a convenience function for that, which I’ll describe in more detail in a later post due to some Rust-side oddities. :)

And writing to a stdio FILE* is probably really common too. So maybe I’ll set up a convenience function for that? Don’t know yet.

Building the library

Oh right! We have to build this code don’t we, or it won’t actually work.

Start with the library itself. Since we’re creating everything but the .h file in Rust-land, we can emit a shared library directly from the Cargo build system by adding a ‘cdylib’ target. In our Cargo.toml:

[lib]
crate-type = ["rlib", "cdylib"]

The “rlib” is a regular Rust library; the “cdylib” is a C-compatible shared library that exports only the C-compatible public symbols (mostly). The rest of the Rust standard library (the parts that get used) are compiled statically inside the cdylib, so they don’t interfere with other libraries that might have been built in a similar way.

Note this means that while a Rust app that uses mtpng and another rlib can share a Rayon ThreadPool instance, a C app that uses mtpng and another cdylib cannot share ThreadPools because they might be different versions etc.

Be warned that shared libraries are complex beasts, starting with the file naming! On Linux and most other Unix systems, the output file starts with “lib” and ends with “.so” (libmtpng.so). But on macOS, it ends in “.dylib” (libmtpng.dylib). And on Windows, you end up with both “mtpng.dll” which is linked at runtime and an “mtpng.dll.lib” which is linked at compile time (and really should be “mtpng.lib” to follow normal conventions on Windows, I think).

I probably should wrap the C API and the cdylib output in a feature flag, so it’s not added when building pure-Rust apps. Todo!

For now, the Makefile or batch file are invoking Cargo directly, and building in-tree. To build cleanly out of tree there are some options on Cargo to specify the target dir and (in nightly toolchain) the work output dir. This seems to be a work in progress, so I’m not worrying about the details too much yet, but if you need to get something working soon that integrates with autotools, check out GNOME’s librsvg library which has been migrating code from C to Rust over the last couple years and has some relevant build hacks. :)

Once you have the output library file(s), you put them in the appropriate place and use the appropriate system-specific magic to link to them in your C program like for any shared library.

The usual gotchas apply:

  • Unix (Linux/macOS) doesn’t like libraries that aren’t in the standard system locations. You have to add an -L param with the path to the library to your linker flags to build against the library in-tree or otherwise not standardly located.
  • Oh and Unix also hates to load libraries at runtime for the same reason! Use LD_LIBRARY_PATH or DYLD_LIBRARY_PATH when running your executable. Sigh.
  • But sometimes macOS doesn’t need that because it stores the relative path to your library into your executable at link time. I don’t even understand that Mach-O format, it’s crazy! ;)
  • Windows will just load any library out of the current directory, so putting mtpng.dll in with your executable should work. Allll right!

It should also be possible to build as a C-friendly static library, but I haven’t fiddled with that yet.

Windows fun

As an extra fun spot on Windows when using the MSVC compiler and libc… Cargo can find the host-native build tools for you, but gets really confused when you try to cross-build 32-bit on 64-bit sometimes.

And MSVC’s setup batch files are … hard to find reliably.

In the current batch file I’ve had some trouble getting the 32-bit build working, but 64-bit is ok. Yay!

Next steps

There’s a lot of little things left to do on mtpng: adding support for more chunks so it can handle indexed color images, color profiles, comments, etc… Ensuring the API is good and error handling is correct… Improving that build system. :)

And I think I can parallelize filtering and deflate better within a chunk, making compression faster for files too small for a single block. The same technique should work in reverse for decoding too.

Well, it’s been a fun project and I really think this is going to be useful as well as a great learning experience. :) Expect a couple more update posts in this series in the next couple weeks on those tuning issues, and fun little things I learn about Rust along the way!
Parallelizing PNG, part 8: Rust macros for constant specialization

In my last posts I covered profiling and some tips for optimizing inner loops in Rust code while working on a multithreaded PNG encoder. Rust’s macro system is another powerful tool for simplifying your code, and sometimes awesomeizing your performance…

Rust has a nice system of generics, where types and functions can be specialized based on type and lifetime parameters. For instance, a Vec<u8> and a Vec<u32> both use the same source code describing the Vec structure and all its functions, but at compile time any actual Vec<T> variants get compiled separately, with as efficient a codebase as possible. So this gives a lot of specialization-based performance already, and should be your first course of action for most things.

Unfortunately you can’t vary generics over constant values, like integers, which turns out to sometimes be something you really wish you could have!

In mtpng, the PNG image filtering code needs to iterate through rows of bytes and refer back to bytes from a previous pixel. This requires an offset that’s based on the color type and bit depth. From our last refactoring of the main inner loop it looked like this, using Rust’s iterator system:

let len = out.len();
for (dest, cur, left, up, above_left) in
    izip!(&mut out[bpp ..],
          &src[bpp ..],
          &src[0 .. len - bpp],
          &prev[bpp ..],
          &prev[0 .. len - bpp]) {
    *dest = func(*cur, *left, *up, *above_left);
}

When bpp is a variable argument to the function containing this loop, everything works fine — but total runtime is a smidge lower if I replace it with a constant value.

Nota bene: In fact, I found that the improvements from this macro hack got smaller and smaller as I made other optimizations, to the point that it’s now saving only a single instruction per loop iteration. :) But for times when it makes a bigger difference, keep reading! Always profile your code to find out what’s actually slower or faster!

Specializing macros

The filter functions look something like this, without the specialization goodies I added:

fn filter_paeth(bpp: usize, prev: &[u8], src: &[u8], dest: &mut [u8]) {
    dest[0] = Filter::Paeth as u8;

    filter_iter(bpp, &prev, &src, &mut dest[1 ..],
	            |val, left, above, upper_left| -> u8
	{
        val.wrapping_sub(paeth_predictor(left, above, upper_left))
    })
}

The filter_iter function is the wrapper func from previous post; it runs the inner loop and calls the closure with the actual filter (inlining the function call out to make it zippy in release builds). Rust + LLVM do a great job of optimizing things up already, and this is quite fast — especially since moving to iterators.

But if we need to specialize on something we can’t express as a type constraint on the function definition… macros are your friend!

The macro-using version of the function looks very similar, with one addition:

fn filter_paeth(bpp: usize, prev: &[u8], src: &[u8], dest: &mut [u8]) {
    filter_specialize!(bpp, |bpp| {
        dest[0] = Filter::Paeth as u8;

        filter_iter(bpp, &prev, &src, &mut dest[1 ..],
                    |val, left, above, upper_left| -> u8
		{
            val.wrapping_sub(paeth_predictor(left, above, upper_left))
        })
    })
}

The “!” on “filter_specialize!” indicates it’s a macro, not a regular function, and makes for a lot of fun! commentary! about! how! excited! Rust! is! like! Captain! Kirk! ;)

Rust macros can be very powerful, from simple token replacement up to and including code plugins to implement domain-specific languages… we’re doing something pretty simple, accepting a couple expressions and wrapping them up differently:

macro_rules! filter_specialize {
    ( $bpp:expr, $filter_closure:expr ) => {
        {
            match $bpp {
                // indexed, greyscale@8
                1 => $filter_closure(1),
                // greyscale@16, greyscale+alpha@8 
                2 => $filter_closure(2),
                // truecolor@8
                3 => $filter_closure(3),
                // truecolor@8, greyscale+alpha@16
                4 => $filter_closure(4),
                // truecolor@16
                6 => $filter_closure(6),
                // truecolor+alpha@16
                8 => $filter_closure(8),
                _ => panic!("Invalid bpp, should never happen."),
            }
        }
    }
}

The “macro_rules!” bit defines the macro using the standard magic, which lets you specify some token types to match and then a replacement token stream.

Here both $bpp and $filter_closure params are expressions — you can also take identifiers or various other token types, but here it’s easy enough.

Note that unlike C macros, you don’t have to put a “\” at the end of every line, or carefully put parentheses around your parameters so they don’t explode. Neat!

However you should be careful about repeating things. Here we could save $filter_closure in a variable and use it multiple times, but since we’re specializing inline versions of it that’s probably ok.

Note that things like match, if, and function calls can all inline constants at compile time! This means each invocation uses the exact-bpp inlined variant of the function.

Down on the assembly line

Looking at the “Paeth” image filter, which takes three byte inputs from different pixels… here’s a fragment from the top of the inner loop where it reads those pixel byte values:

movdqu (%rcx,%r9,1),%xmm1     ; read *left
movdqu (%rsi,%rbx,1),$xmm3    ; read *up
movdqu (%rsi,%r9,1),%xmm5     ; read *above_left

(Note we got our loop unrolled and vectorized by Rust’s underlying LLVM optimizer “for free” so it’s loading and operating on 16 bytes at a time here.)

Here, %rcx points to the current row and %rsi to the previous row. %rbx contains the loop iterator index, and %r9 has a copy of the index offset by -bpp (in this case -4, but the compiler doesn’t know that) to point to the previous pixel.

The version with a constant bytes-per-channel is able to use the fixed offset directly in x86’s addressing scheme:

movdqu (%rcx,%rbx,1),%xmm1    ; read *left
movdqu (%rsi,%rbx,1),%xmm5    ; read *above_left
movdqu 0x4(%rsi,%rbx,1),%xmm3 ; read *up

Here, %rbx has the previous-pixel index, and there’s no need to maintain the second indexer.

That doesn’t seem like an improvement there — it’s the same number of instructions and as far as I know it’s “free” to use a constant offset in terms of instructions per cycle. But it is faster. Why?

Well, let’s go to the end of the loop! The variable version has to increment both indexes:

add $0x10,%r9   ; %r9 += 16
add $0x10,%rbx  ; %rbx += 16
cmp %r9,%r14    ; if %r9 > len - (len % 16)
jne f30         ; then continue loop

but our constant version only has to update one.

add $0x10,%rbx ; %rbx += 16
cmp %rbx,%r8   ; if %rbx > len - (len % 16)
jne 2092       ; then continue loop

Saved one instruction in an inner loop. It’s one of the cheapest instructions you can do (adding to a register is a single cycle, IIRC), so it doesn’t save much. But it adds up on very large files to …. a few ms here and there.

The improvement was bigger earlier in the code evolution, when I was using manual indexing into the slices. :)

Macro conclusions

  • Always profile to see what’s slow, and always profile to see if your changes make a difference.
  • Use generics to vary functions and types when possible.
  • Consider macros to specialize code in ways you can’t express in the generics system, but check that the compiled output does and performs how you want!

I may end up removing the filter specialization macro since it’s such a small improvement now and it costs in code size. :) But it’s a good trick to know for when it’s helpful!

Next: interfacing Rust code with C!


Parallelizing PNG, part 7: Rust profiling on Linux

I already covered some inner-loop optimization tricks for low-level Rust code in mtpng, but how do you check how fast bits of your code are anyway?

It’s fairly easy to wrap your whole code in a timer, which I’ve done for convenience of testing total runtime:

extern crate time;
use time::precise_time_s;

...

let start_time = precise_time_s();
write_png(&outfile, header, options, &pool, &data)?;
let delta = precise_time_s() - start_time;

println!("Done in {} ms", (delta * 1000.0).round());

(High-level benchmarks like this are supported in nightly/unstable Rust via “cargo bench”, or in stable with some additional tools.)

It’s a pain in the butt to do that kind of testing on all your inner functions though, and taking the timings affects your performance so you really shouldn’t try!

The way to go is to use a sampling-based profiler native to your operating system. I’ve done most of my detailed profiling on Linux, using the “perf” tool.

Build preparation

Currently the “cargo” package manager doesn’t support a profiling-specific … profile … for building. You need debug symbols or you won’t understand much of your profile details, but you need a fully optimized build or why bother measuring its performance?

It’s fairly easy to add debug info to your release builds in your Cargo.toml file:

[profile.release]
# Unoptimized debug builds are too slow to profile
# having debug info doesn't hurt perf for now
debug = true

Though you might want to remove it before making binary releases. :)

Alternatively you could remove all the things that slow down performance from the debug profile and add optimization to it.

Perf is good

Perf seems to have come from Linux kernel-land, and has all kinds of magical abilities of system-wide profiling I haven’t even fathomed yet. But it’s fairly easy to use for quick and dirty profiling!

Run your program with “perf record” plus your command line; I usually go ahead and run via “cargo run” and then skip through the cargo invocation so I don’t have to go finding the binary under targets/release/bin or whereever.

$ perf record cargo run --release -- in.png out.png --threads=1

(Using a single worker thread makes it easier to read the profile, though sometimes you want to go crazy and test with all threads. Perf will happily record all the threads and child processes!)

If you have a long-running process you want to attach to at runtime, you can do that with the -p option and the pid:

$ perf record -p 12345

This causes a very slight slowdown to your program as it records, but it’s consistent over time and can measure hotspots down to the instructions!

Reporting for duty

Once you’ve run the program, pull up an interactive report in your terminal with “perf report”:

$ perf report

You can also save multiple recordings and pick up a past one, if you want to compare multiple runs of versions of your program.

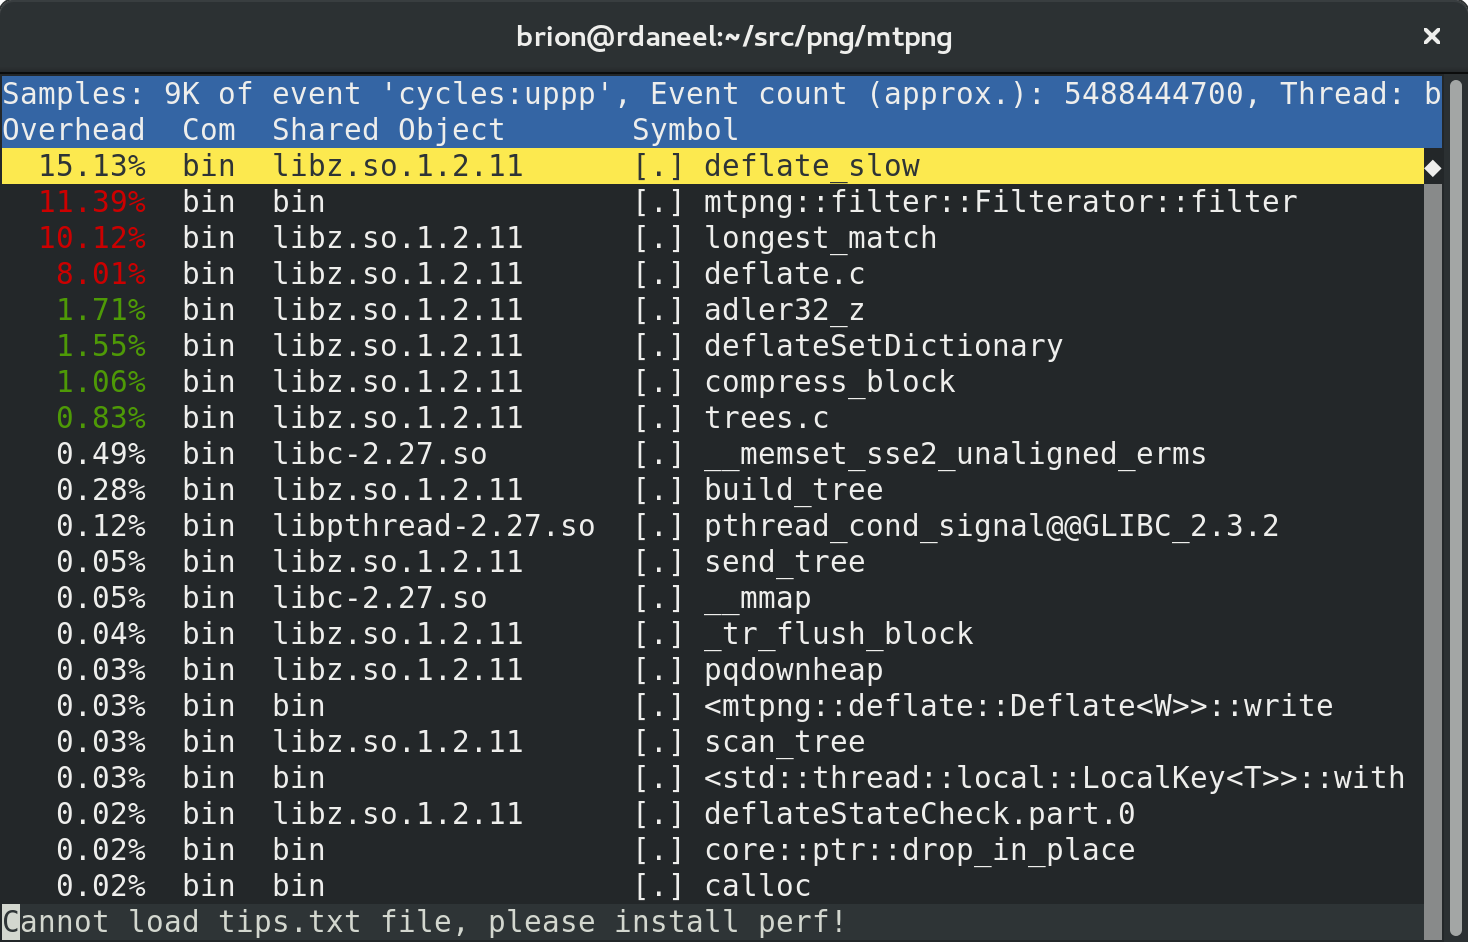
The initial view will be of the entire run: all processes, all threads, every symbol in it. (You won’t see symbols for system libraries unless you’ve installed debug info packages.)

That “Cannot load tips.txt file” seems to be a packaging problem with perf in Fedora. :) It’s harmless.

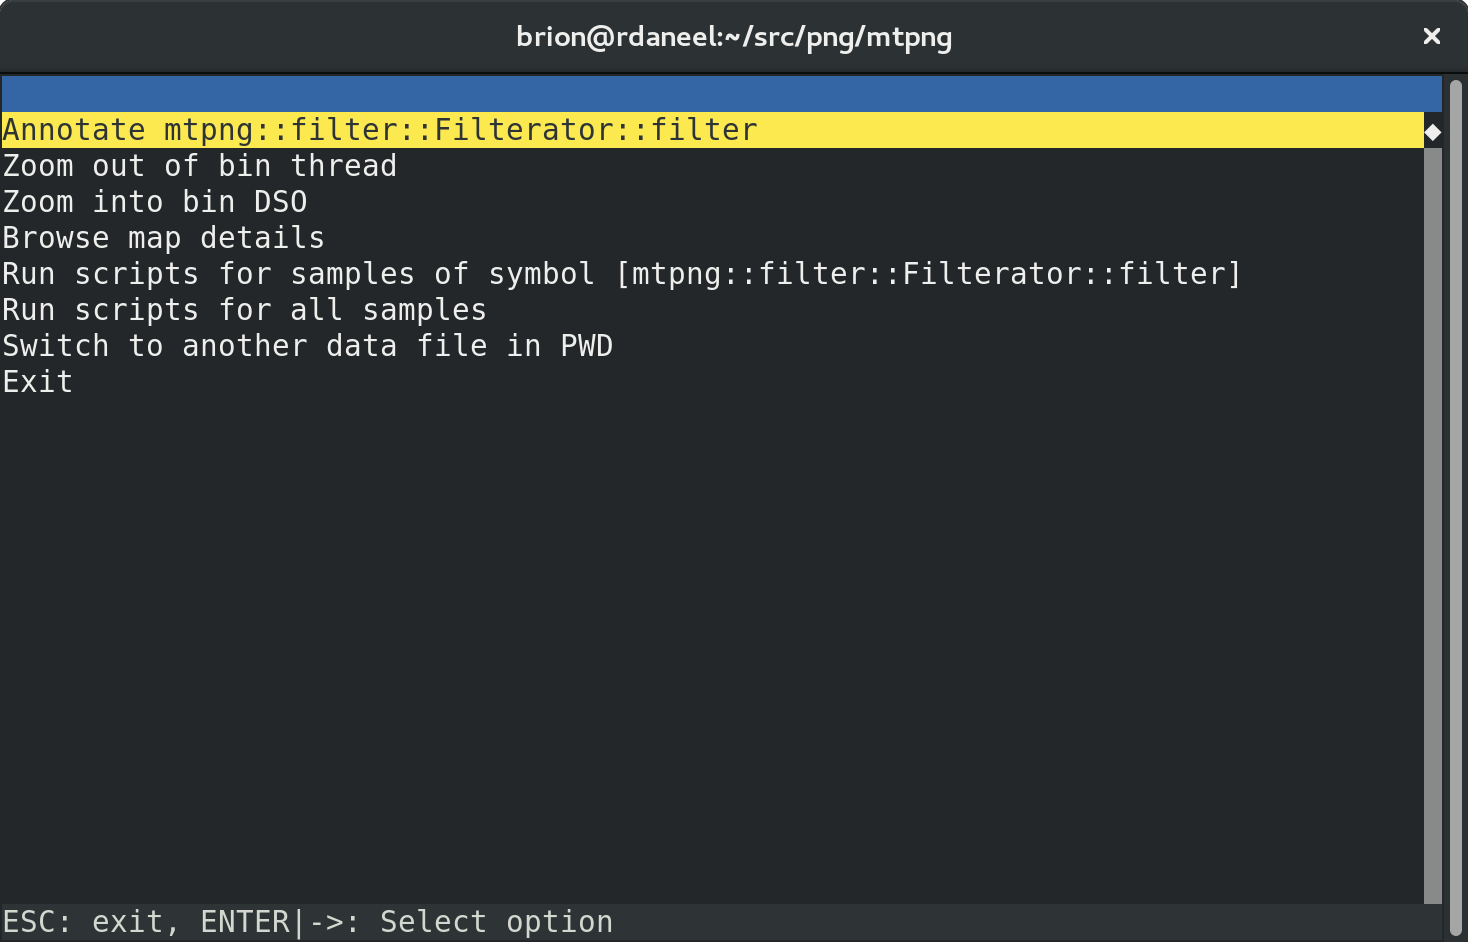
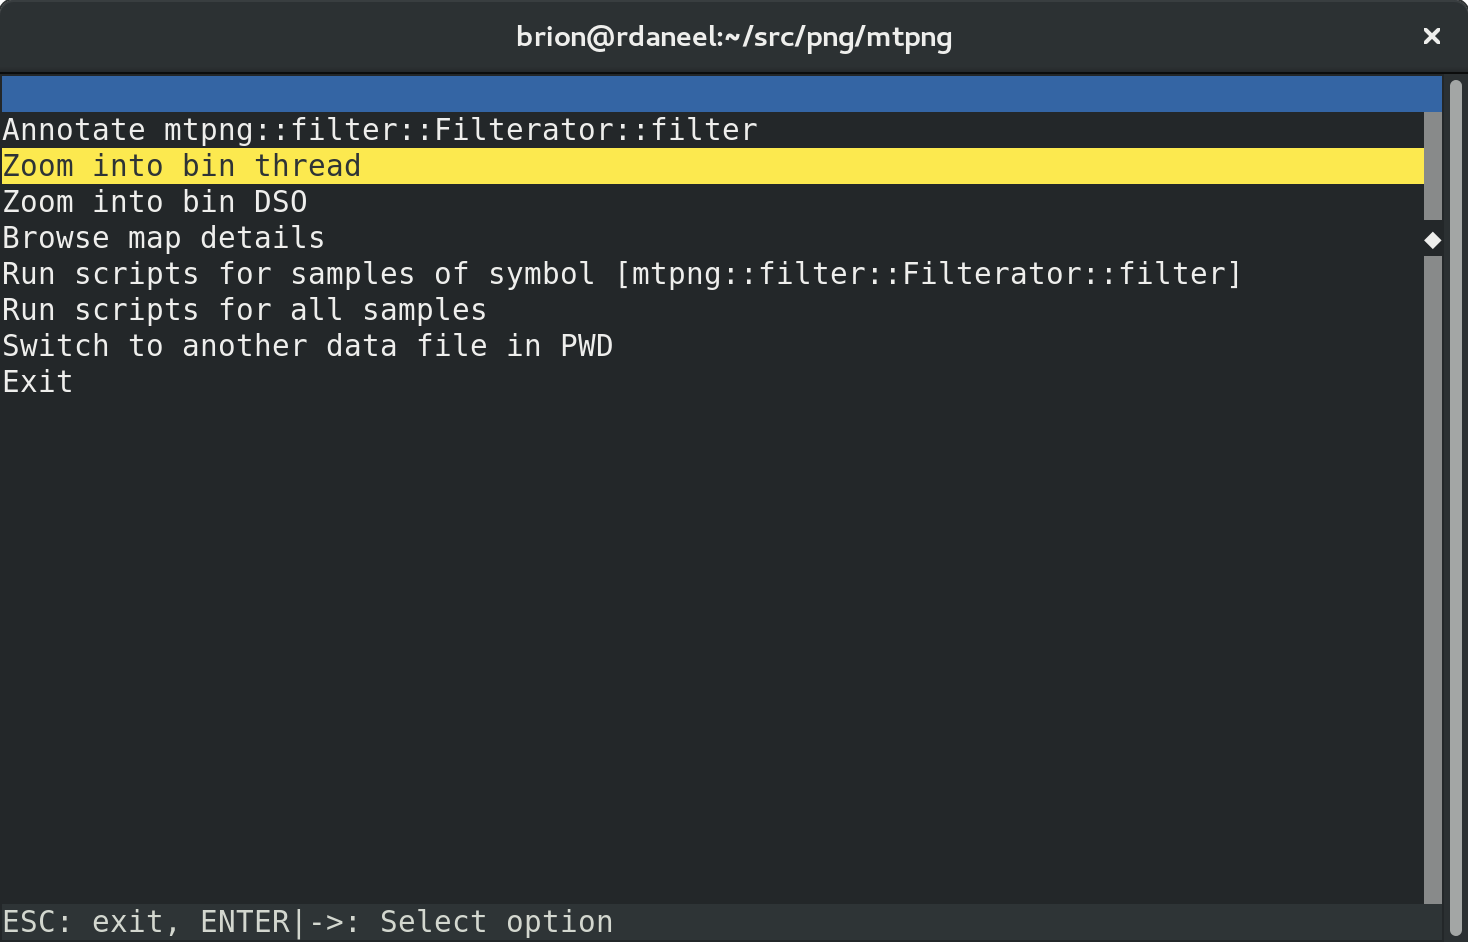
Use the arrow keys to pick an item of interest — in this case mtpng::filter::Filterator::filter — and hit enter to get a menu:

“bin” is the name of my binary (clever), so let’s first dive into the relevant worker thread from my process, and ignore the rest:

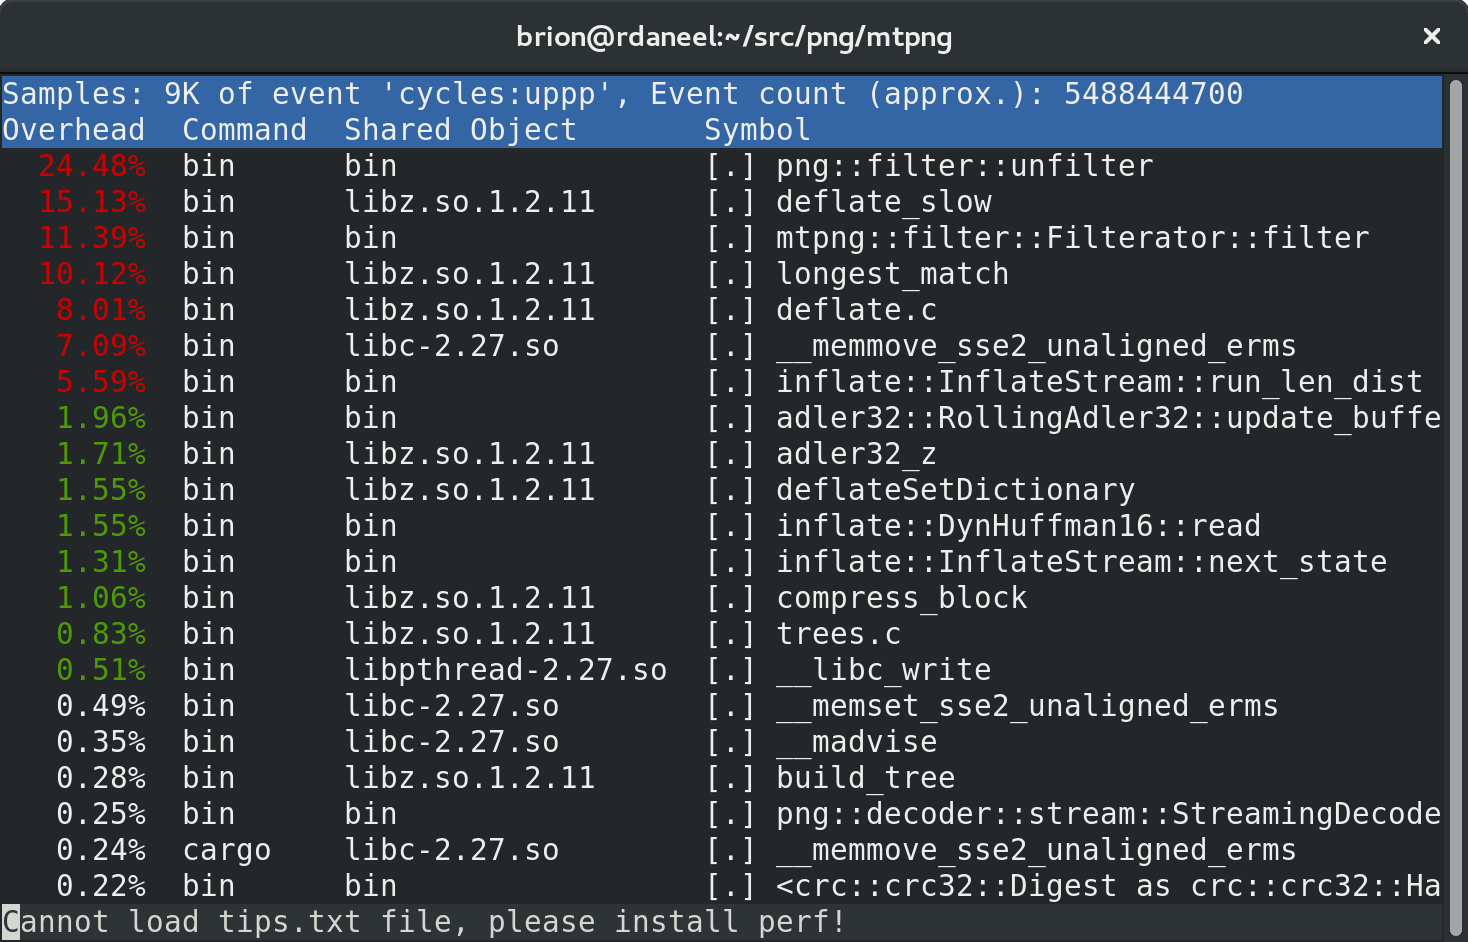
Now we can see that the biggest individual time cost in the worker thread pool is libz’s “deflate” compression! This is only because we’re seeing the profile after a few days of optimization. Before, the biggest was the filter call. :D

Let’s scroll down and hit enter to look at the filter function in detail:

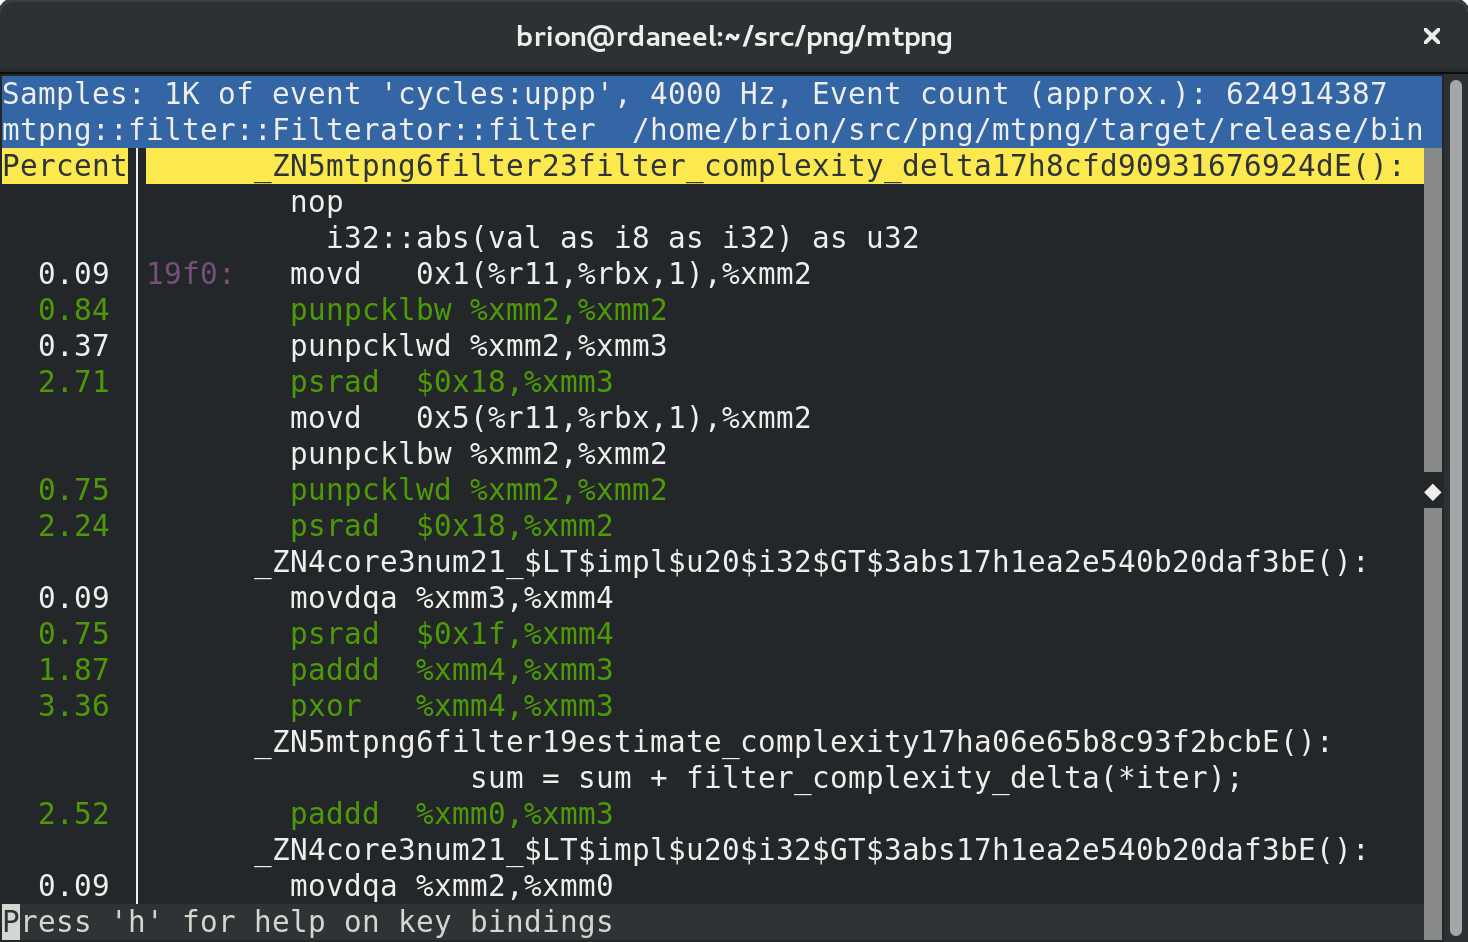
Hit “Annotate” and the real fun starts:

It’ll pop you into what it thinks is the biggest hotspot, but in a big function you might have to scroll around to find the relevant stuff.

You’ll notice both the instruction-by-instruction disassembly gibberish (useful but tricky to understand!) and little bits of your original source and (mangled) symbol declarations.

In heavily optimized Rust code it can be hard to follow exactly what’s going on because things get re-ordered and there can be magic under the hood you didn’t realize were happening… but it can be enough to piece together which individual parts of your function are slow, and to see which bits are different when you change something.

In this case we can see that the filter complexity heuristic loop has been auto-vectorized to use SSE instructions, even though my source code is a regular call in an iterator loop. Pretty rad!

Next post: using Rust macros to specialize functions for fun and performance!

Parallelizing PNG, part 6: Rust slices and loop optimization

Looking at interesting patterns and bottlenecks I discover working on a multithreaded PNG encoder in Rust

A common pattern in low-level code is passing around references to data buffers that are owned somewhere higher up the call chain. In C you either send a pointer and a length as a pair of parameters, or you send a pointer and have a convention like NULL-termination, and then you carefully read and write only within that region…

Take a slice

In Rust, you use a data type called a “slice”, which is as pointer+length pair but with safer semantics and some really nice syntactic sugar. :) A slice can be … sliced … out of any contiguous structure like a fixed-size array, a resizable vector, or another slice.

There’s two big safety improvements over C pointers:

  • Rust’s compile-time borrow checker system ensures that only one piece of code holds a mutable reference to the underlying data, so you can’t have an invalid reference. (Imagine having a slice into a vector, and then the vector resizes due to an append! Can’t happen.)
  • Access via index (my_slice[i]) is bounds-checked at runtime. Like dereferencing a null pointer in C, it will probably* kill your process to access a slice out of bounds.

[Update: *Dereferencing null in C is “undefined behavior” and sometimes doesn’t crash, depending on the system and whether you’ve installed signal handlers. Rust’s “panics” are more defined in how they behave, and can in some cases be caught and recovered from. But by default, either is bad for you if you don’t handle it! ;)]

“But wait!” I hear you say. “Bounds checks at runtime are sslloowww!” Well there’s ways around that. :)

Bounds checkin’

So what is indexing into an array anyway? The index value is a “usize” (unsigned integer, pointer-sized) which is behind the scenes added to the underlying pointer to produce a final pointer. So we can think of my_slice[i] = x as doing something like this behind the scenes:

*(my_slice.as_ptr() + i) = x;

With the bounds check, it looks something like:

if i < my_slice.len() {
    *(my_slice.as_ptr() + i) = x;
} else {
    panic!("Out of bounds");
}

Note that you don’t need to check for i >= 0 because it’s an unsigned type!

But what about in a loop? Won’t that check slow tight loops down?

for i in 0 .. my_slice.len() {
    if i < my_slice.len() {
        *(my_slice.as_ptr() + i) = x;
    } else {
        panic!("Out of bounds");
    }
}

That looked kind of redundant right? Isn’t the loop already checking that i < my_slice.len() on every iteration? In fact it is… And in an optimized build, the bounds check can actually be removed by the optimizer!

Don’t be afraid to let the optimizer do your work for you — the default-immutability and ownership semantics of Rust mean there’s a lot of things like that that improve dramatically in an optimized build while still retaining code that’s both straightforward to read and refactor, and performs well.

Iterators

Using a for loop with an index range isn’t always considered good style in Rust, both because of those bounds checks and because iterators are far, far more flexible since they can work with other data structures than slices.

An iterator version of that little loop would start out as:

for iter in my_slice.iter_mut() {
  *iter = x;
}

You call iter_mut() to get a mutable reference, or iter() for immutable. Each pass through the loop gives you a reference to the element which you can read or write appropriately.

For a slice that essentially compiles down to the same as the for loop with an index range, but without needing the intermediate check even in unoptimized builds.

Cheating

You can also use the “unsafe” get_unchecked and get_unchecked_mut functions to get a reference to an indexed value without the bounds check! But you have to wrap in an “unsafe” block, because Rust makes you label stuff like that. :D

for i in 0 .. my_slice.len() {
    unsafe {
        *(my_slice.get_unchecked_mut(i)) = x;
    }
}

Multiple slices and the optimizer

In mtpng I found a case where I had to use indexing instead of iterators because I was working with multiple slices in sync, which introduced several bounds checks.

I found that adding validation checks that the lengths were all the same actually made all the bounds checks disappear, doubling the speed of the tight loop and improving overall encode speed by over 25%.

Without the validation, the function looked something like this:

fn filter_iter<F>(bpp: usize, prev: &[u8], src: &[u8], out: &mut [u8], func: F)
    where F : Fn(u8, u8, u8, u8) -> u8
{
    for i in 0 .. bpp {
        let zero = 0u8;
        out[i] = func(src[i], zero, prev[i], zero);
    }
    for i in bpp .. out.len() {
        out[i] = func(src[i], src[i - bpp], prev[i], prev[i - bpp]);
    }
}

With the checks added at the top, before the inner loop:

fn filter_iter<F>(bpp: usize, prev: &[u8], src: &[u8], out: &mut [u8], func: F)
    where F : Fn(u8, u8, u8, u8) -> u8
{
    assert!(out.len() >= bpp);
    assert!(prev.len() == out.len());
    assert!(src.len() == out.len());

    for i in 0 .. bpp {
        let zero = 0u8;
        out[i] = func(src[i], zero, prev[i], zero);
    }
    for i in bpp .. out.len() {
        out[i] = func(src[i], src[i - bpp], prev[i], prev[i - bpp]);
    }
}

At runtime those extra checks at the top should never trigger, because all three slices are the same length and bpp is never larger than the length. But the optimizer didn’t know that! Making the invariant explicit in the code, instead of just hoping it was right, lets the optimizer turn all of these:

[Updated: using the assert! macro is better style than manually calling panic! in your high-level code. Note that assert! code is always present in both debug and release builds; use the debug_assert! macro for checks that aren’t necessary for safety or performance.]

for in in bpp .. out.len() {
    if i < src.len() {
        if i < prev.len() {
            if i < out.len() {
                out[i] = func(src[i], src[i - bpp], prev[i], prev[i - bpp]);
            } else {
                panic!("Out of bounds");
            }
        } else {
            panic!("Out of bounds");
        }
    } else {
        panic!("Out of bounds");
    }
}

Into this with no bounds checks:

for in in bpp .. out.len() {
    out[i] = func(src[i], src[i - bpp], prev[i], prev[i - bpp]);
}

Pretty neat right!

zip and izip!

Update: The above case can also be rewritten with iterators by “zipping” multiple iterators together.

If you only have two iterators, you can use the “zip” function in the standard library; if you have more you can use the “izip!” macro in the itertools crate.

This ends up with code that can be a bit verbose but should also run cleanly:

let len = out.len();
for (dest, cur, left, up, above_left) in
    izip!(&mut out[bpp ..],
          &src[bpp ..],
          &src[0 .. len - bpp],
          &prev[bpp ..],
          &prev[0 .. len - bpp]) {
    *dest = func(*cur, *left, *up, *above_left);
}

[Update: I was able to confirm that careful use of izip! slightly outperforms indexing plus voodoo assertions, removing another instruction or two per inner loop iteration. If you can write sanely that way, it works nicely! Won’t work if you need random access to the various slices, but for this kind of lock-step iteration it’s perfect.]

Debug vs release builds

The rust compiler and the cargo package manager default to unoptimized debug builds if you don’t tell it to make a release build.

This sounds good, except the entire Rust standard library is built on the same patterns of using safe clean code that optimizes well… For mtpng I’m seeing a 50x slowdown in runtime in unoptimized debug builds versus optimized release builds. Yeeeooooowwwwch!

Note that you can change the optimization level for your own debug builds in the Cargo.toml file in your project, which can help; you can crank it all the way up to a release build’s optimization status or leave it somewhere in the middle.

Parallelizing PNG, part 5: choosing Rust for mtpng

In my last post I wrapped up the patches to improve perceived performance of screenshots on the Linux GNOME desktop. With that done, why not implement my crazy plan for parallel PNG encoding to speed the actual save time?

Before starting any coding project, you need to choose a language to implement it in. This is driven by a number of considerations: familiarity, performance, breadth and depth of the standard library, and whether it’ll fit in with whatever eventual deployment target you have in mind.

Now C here

I’ve done a fair amount of coding in C, it’s well known for performing well, and it’s the default for most of the components in GNOME, so that’s a plus… but its standard library is small, its type and macro systems are limited so repetitious code is common, and memory management is notoriously unreliable — especially in multithreaded situations. I would either have to implement some threading details myself, or find a library to use… which might introduce a dependency to the GNOME platform.

There’s also C++, C’s weird cousin. Templates are way more powerful than C macros, but I have trouble wrapping my head around the details, and error messages expose a lot of details. Memory management and, in latest versions threading, are a big improvement! But it adds the C++ standard library as a dependency, which might or might not fly for GNOME.

My usual go-to languages are PHP and JavaScript, neither of which are suitable for a high-performance binary-parsing system component. :)

Getting Rust-y

But what about Rust? It’s being used by some other GNOME components such as librsvg which renders SVG icons (and is also used by us at Wikimedia for rendering thumbnails of SVG icons, diagrams, and maps!), and can be integrated into a C-compatible library without introducing runtime or install-time dependencies.

Rust’s type system is powerful, with a generics system that’s in some ways more limited than C++ templates but much easier to grok. And it also has a macro system that can rewrite bits of code for you in a way that, again, I find a lot easier to comprehend than C++ templates and is much more powerful than C macros.

And the memory management is much cleaner, with a lot of compile-time checking through a “borrow checker” system that can identify a HUGE number of memory-misuse problems long before you get into the debugger.

Plus, Rust’s community seems friendly, and they’ve got a good package manager system that makes it easy to pull in compile-time dependencies to fill in gaps in the standard library.

I’ve been keeping an eye on Rust for a couple years, reading a lot of docs and some books, and half-starting a few tiny test projects, but never had a project in front of me that seemed as good a time to start as this!

Well that’s just crate

Packages in Rust are called “crates”, and the package manager is named “cargo”. A crate can contain a library, a binary, or both, and can have tests, docs, examples, and even benchmarks that can be run by the package manager.

Creating a stub library crate via ‘cargo init –lib’ is fairly straightforward, and I was able to immediately have something I could compile and have tests run on with ‘cargo test’!

As an editor I’m using Visual Studio Code, which has an “rls” package which provides Rust support including inline display of compiler warnings and errors. This is a *huge* improvement versus manually switching to a terminal to run compiles to check for errors, especially as cascading errors can scroll the initial cause of your error off the screen. ;) But the error messages themselves are usually clear and helpful, often suggesting a fix for common problems.

I’m also able to run my tests on Linux, macOS, and Windows machines without any additional work, as Rust and cargo are pretty portable.

From there, I was able to start adding tiny parts of my plan, bit by bit, with confidence.

Atypical types

Rust’s type system has a number of quirks and interesting points, but the most important kinds of things are structs and enums.

Structs are like structs or classes in C++, kinda sorta. Their fields can be exposed publicly or private to the module, and they can have methods (more or less). Here’s one from the project so far:

#[derive(Copy, Clone)]
pub struct Options {
    pub chunk_size: usize,
    pub compression_level: CompressionLevel,
    pub strategy: Strategy,
    pub streaming: bool,
    pub filter_mode: FilterMode,
}

The “derive(Copy, Clone)” bit tells the compiler to treat the struct as something that can be trivially copied, like a primitive value. Not always what you want for a struct; I may remove this in my final API. The fields are also exposed directly with “pub”, which I may change to a builder pattern and accessors. But it’s an easy way to get started!

An associated “impl” block adds your associated functions and methods. The compiler checks that you initialized all fields; it’s impossible to end up with uninitialized memory by accident.

impl Options {
    // Use default options
    pub fn new() -> Options {
        Options {
            chunk_size: 128 * 1024,
            compression_level: CompressionLevel::Default,
            strategy: Strategy::Default,
            filter_mode: FilterMode::Adaptive,
            streaming: true,
        }
    }
}

Meanwhile, Rust enums can be made to work like a C enum, which is mostly a list of constant values, but they can also be a very powerful construct!

Here’s a boring enum example which maps names for the PNG byte filters to their codes:

#[derive(Copy, Clone)]
pub enum FilterType {
    None = 0,
    Sub = 1,
    Up = 2,
    Average = 3,
    Paeth = 4,
}

And here’s one that’s more interesting:

#[derive(Copy, Clone)]
pub enum FilterMode {
    Adaptive,
    Fixed(FilterType),
}

This means a FilterMode can be either the value “Adaptive” or the value “Fixed”… with an associated sub-value of type FilterType. These are kind of like C unions, but they’re not awful. ;)

That fancy enum pattern is used everywhere in Rust, with the Option<T> enum (either None or Some(T)) and Result<T, E> (either Ok(T) or Err(E)). In combination with the “match” construct this makes for great parsing of command line options into optional settings…

options.filter_mode = match matches.value_of("filter") {
    None             => FilterMode::Adaptive,
    Some("adaptive") => FilterMode::Adaptive,
    Some("none")     => FilterMode::Fixed(FilterType::None),
    Some("up")       => FilterMode::Fixed(FilterType::Up),
    Some("sub")      => FilterMode::Fixed(FilterType::Sub),
    Some("average")  => FilterMode::Fixed(FilterType::Average),
    Some("paeth")    => FilterMode::Fixed(FilterType::Paeth),
    _                => return Err(err("Unsupported filter type")),
};

There’s a little redundancy of namespaces that I can clean up with better naming there, but you get the idea. Note you can even match on an enum containing a string!

Threading with Rayon

Another big concern of mine was being able to do threading management easily. Rust’s standard library includes tools to launch threads and safely send ownership of data between them, but it’s a little bare bones for running a threadpool with a queue of work items.

The Rayon library was highly recommended; it includes both a really solid ThreadPool class that you can drop function closures into, and higher-level constructions building on top of iterators to, for instance, split a large arra-based process into small chunks.

I ended up not using the fancy iterator systems (yet?) but the ThreadPool is perfect. Combined that with message passing from the standard library to send completed blocks back to the main thread for processing, and I was able to get a working multithreaded app going in about two days, with my bugs almost entirely about my filtering, compression, and output file structure, and not the threading. :)

Deflation for once

The last main library component I needed was the actual data compression — I can implement image filtering and chunk output myself, and it was easy to grab a crc32 library via a crate. But the ‘deflate’ compression algo looks hard, and why reimplement that if I don’t have to?

There are several ‘deflate’ and ‘gzip’ implementations written in Rust available as crates, but none of them included all the abilities I needed for parallel chunked compression:

  • overriding the sliding-window dictionary with the previous chunk’s last 32 KiB of uncompressed data to improve compression across chunks
  • flushing output at the end of each chunk without marking the last block as end-of-stream

Possibly I’ll find some time later to figure out how to add those features. But for now, I used the C zlib library (the same one used by the C libpng library!) through an API adapter crate that exposes the absolute minimum C API of zlib as Rust functions and types.

It shouldn’t introduce dependencies since zlib is already used by …. lots of stuff. :D

So how’s it working out?

Pretty well. Check out my mtpng project over on github if you like!

I got it mostly working for truecolor images in about 3 days, and did some performance tuning later in the week that sped it up enough it’s often beating libpng on a single thread, and always beats it using multiple threads on large files.

The API needs work before I publish it as a crate, so I’ll keep fiddling with it, and I haven’t yet figured out how to implement the C API but I know it can be done. I’ve also got a long list of todos… :)

I’ll add more blog posts soon on some interesting details…

Om nom NUMA

While tuning BIOS settings on my old workstation PC with two CPU sockets, I noticed a setting I hadn’t touched in a long time if ever — the “memory interleaving mode” could be tuned for either SMP or NUMA, and was set on SMP.

What… what does that mean? SMP is Symmetric Multi-Processing and I’ve heard that term since ages past in Linux-land for handling multiple CPUs and cores. NUMA is just some server thing right?

So… NUMA is Non-Uniform Memory Access, and here specifically refers to the fact that each CPU socket has its own connection to its share of system memory that’s slightly faster than accessing the same memory through the other CPU socket.

With the BIOS’s memory interleave mode set to NUMA, that speed differential is exposed to the operating system, and memory from each processor is assigned to a separate region of physical memory addressing. This means the OS can assign memory and processor time to any given process optimized for speed as much as possible, only slowing down if a given process runs out of stuff fitting on one socket. Cool right?

Meanwhile with it set to SMP, the memory is laid out interleaved, so any given piece of memory might be fast, or it might be slow. Lame right?

So.

I tried it for fun, on Linux and Windows both and at first didn’t see much difference. Using valgrind’s “cachegrind” tool confirmed that the things I was testing (PHP in a tight interpreter loop, or PNG compression) were mostly working in-cache and so memory latency wasn’t a big deal, and memory bandwidth is nooooowhere near being saturated.

Then I found a case where NUMA mode fell down badly: multithreaded app with more threads than physical CPU cores on a single socket.

Running my PNG compression tests at 1, 2, 4, or 16 threads ran about as fast with SMP or NUMA mode. But at 8, there was a big dip in speed.

Since I have 2x quad-core processors with hyper-threading, the layout is:

  • 2 sockets
    • 4 cores per socket
      • 2 threads per core

SMP mode assigns threads to logical processors like this:

  • 1 thread – runs on either socket
  • 2 threads – one on each socket
  • 4 threads – two on each socket, on separate cores
  • 8 threads – four on each socket, on separate cores
  • 16 threads – eight on each socket, packing all cores’ threads

NUMA mode prefers to group them together, because they’re all in a single process:

  • 1 thread – runs on either socket
  • 2 threads – two on one socket, on separate cores
  • 4 threads – four on one socket, on separate cores
  • 8 threads – eight on one socket, packing all cores’ threads
  • 16 threads – eight on each socket, packing all cores’ threads

Now we see the problem! Because Hyper-Threading shares execution resources between the two threads of each core, you don’t get as much work done when both threads are packed.

If I hadn’t had Hyper-Threading on, 8 threads would’ve scaled better but it wouldn’t be able to run 16 (at a sllliiiggghhhtt speed boost) anymore.

Putting it back on SMP mode for now. For a system that’s always under full load NUMA is theoretically superior, but it interacts with Hyper-Threading weirdly for my up-and-down desktop/workstation workload.


Parallelizing PNG compression, part 4: patching GNOME

Continuing last week’s series on parallelizing things to speed up saving screenshots as PNGs on GNOME!

Going back to the original GNOME desktop screenshot issue: there’s a long delay after hitting “PrintScreen” before audiovisual feedback confirms that a screenshot has been taken, especially at very high resolutions and a slower CPU.

The modular GNOME

Screenshot operations in the GNOME desktop environment are split over two modules: gnome-shell (which as the compositor has access to the raw screen data under both X11 and Wayland modes), and gnome-settings-daemon (gsd) which has some kind of facility for global keyboard shortcuts.

Current order of operations is thus:

  1. gsd’s keyboard shortcut handler for screenshots makes a call to the shell over D-Bus
  2. shell captures the screen
  3. shell compresses the image and saves it to disk
  4. shell starts a visual “flash” effect
  5. shell returns a success value to gsd over D-Bus
  6. gsd starts the “click” sound from the audio theme

Mysteriously the sound and the visual effects are started in different processes, but at about the same time so they feel synchronized. Just after a long delay from my keypress!

Fixing it

The proposed fix I outlined in a previous post seems pretty feasible, and I was able to whip up a proof of concept:

But how do you test that?

Building and testing GNOME Shell

GNOME is a pretty big environment with a lot of moving parts, and can take a few hours to build. Building a single package from the latest version control is difficult because a lot of components need to be in sync!

There are two (at least) systems for building the entirety of GNOME for testing: BuildStream is the current recommended system, and is pretty awesome, but you can’t test some components like the shell.

The older system is jhbuild, which has been around for a few years and I have some bad memories of weird broken builds in the distant past. :D

Note that BuildStream is very self-contained and produces an isolated system set, while jhbuild grabs a lot of dependencies from the host system and can be more … fragile.

Build gotchas: WebKitGtk+

When I first tried building with BuildStream, I complained that a very slow portion of the build was WebKitGtk+ being limited to only 2 threads on my 8-core machine.

But when I tried again with jhbuild, I found that no such limit was applied — it was happily running 16 simultaneous compiles (remember hyper-threading!) and …. running …. out of memory. Some of the giant “unified build” C++ files in WebKit were eating up ~1.5 GiB of RAM each, and at 16 threads that goes wwaayy past the 12 GiB available on the system!

I added some swap space, and it ran further but vveerryy sslloowwllyy.

WebKitGtk’s build is with meson (ninja) which defaults to running enough build threads to fill your available CPUs. There’s a command line option (-j) to override it, but I couldn’t figure out offhand how to change the command line that gets invoked by jhbuild’s meta-build system. (There’s not an environment variable to override it, which would have been easier to do I think.)

As a quick hack I temporarily disabled hyper-threading in the BIOS to reduce the number of logical CPU cores, and thus autodetected processes, so only half as much RAM was used. :P

This got the build through WebKit and I was able to re-enable HT and eventually get to patching gnome-shell.

Testing the shell

To properly test the shell and daemons you need to open a new gdm desktop session running the custom-built stuff, but I’m not really sure how to do that yet. :)

So far I’ve tested just the shell component, which you can swap out for the currently running shell like so:

$ jhbuild run gnome-shell --x11 -r

Beware that if it breaks, you have no shell / window manager anymore and it’s…. a bad experience.

Be very careful that you can restart the shell with the mouse or something, as keyboard focus breaks when the shell dies! :D

Note that running the patched gnome-shell with the system’s unpatched gnome-settings-daemon produces a nicely timed “click” + “flash” and then a second “click”. :) If the two modules are run both patched, the second click will be removed.

One more thing

Doing more thorough benchmarking for our next post, I noticed that the actual save operation in the shell (via gdk-pixbuf, via libpng) is also 30% slower than it needs to be because gdk-pixbuf enables an unnecessary transform operation in libpng.

Fix for gdk-pixbuf is submitted, and merged!

Coming up: getting Rust-y with mtpng

I’ve also made great strides on the actual encoding parallelization. More to come!

Parallelizing PNG compression, part 3: what’s in a PNG anyway?

While I’m waiting to figure out how to build and test my patch to GNOME Shell to speed up screenshotting, let’s look at the other problem — speeding up the compression of large PNG images on multicore systems.

What’s in a PNG anyway?

The PNG image format is composed of a series of “tagged chunks”, sections of a file with a type tag, a length, and a data payload. The only one that we care about here is the IDAT chunk, which contains the compressed image data.

From the perspective of the compressor, there are a few operations that need to be done, in a pipeline:

  1. Pack input pixels into the correct format.
  2. Optionally apply one of 5 filters which can improve the compressibility of the bytes.
  3. Send the filter ID and the bytes into the ‘deflate’ compressor.
  4. Write compressed bytes to output as one or more IDAT chunks.

There’s no particular benefit to using multiple IDAT chunks unless you’re aggressively streaming output (in which case it adds a few bytes for each chunk boundary).

libpng’s pixel format transformations are surprisingly expensive in the profiling run I did (>10% of samples!) and this step can probably be improved in its own right. I haven’t yet looked into that.

Filters are applied byte-wise on the packed pixel data, and are described in detail in the PNG spec. They require the previous line as input (or a 0’d out line for the first line!). Five different filter modes are defined, and encoders are recommended to use heuristics to guess which mode will compress best (say, by trying them all). Haven’t yet dived into the libpng source for the algo used, but profiling shows the filter application step totaling about the same CPU time as the deflate compression step (~27% of CPU samples)

The filter mode byte and the filtered data are then pumped into the deflate compressor, implemented by the standard zlib library.

So what’s in a deflate?

Now we’re at the fun part. That filtering stuff sounded really easy to parallelize by breaking up the input into line-wise chunks, but what about the compression?

A compressed deflate stream consists of a 2-byte header followed by a series of blocks, either uncompressed or compressed. Uncompressed blocks have a count of bytes to copy (with a maximum size), and compressed blocks are composed of Huffman-coded symbol lists. Oh and for fun, compressed blocks do not have to be aligned on byte boundaries. They’re actually bit streams! And they have no maximum size… Block boundaries depend on the input data and how well the compression identifies redundancy. Then at the end there’s a checksum of input data.

The easiest way to get parallelism is to divide up the input data (the filtered pixels) into chunks of some size that’s large enough not to affect compression much but not so large that you don’t have enough chunks to fill the CPU cores. Run each set separately, and stitch the resulting output back together fixing up the headers and checksums.

By “easy” I meant “slightly tricky”, but not totally impossible. :)

A few tricks to this:

  • To ensure each chunk’s output ends on a byte boundary, use Z_SYNC_FLUSH (or Z_FINISH on the last chunk) option to deflate. This will if necessary add a 0-byte uncompressed block to output, which resyncs to a byte boundary.
  • Blocks can refer to prior input data in a “sliding window” of up to 32KiB to gain a little extra compression across blocks. This can be handled by using deflateSetDictionary to pass the previous 32KiB of input as the dictionary. (But be warned, that changes the header bytes you have to skip over!)
  • The adler32 checksums of each chunk’s input can be re-combined using adler32_combine, or could be calculated separately from the deflate call.

All this stuff is done by the excellent standalone tool pigz but it’s not available as a library (yet!).

Parallelizing that PNG

The one example of someone attempting to do this specifically in PNG that I’ve found is png-parallel, an experiment which seems to have been abandoned some time ago. I made a fork and fixed it up to build on Fedora 28 and more or less work, and it looks promising so far.

The actual code is a bit hacky, and uses OpenMP for threading which is probably a dependency nightmare, but with a few tweaks I got it building, and producing valid PNG files, and scaling pretty well up to 8 threads or beyond!

There are two limitations which prevent me from showing any benchmarks yet:

  • the null filter is used instead of running the adaptive filter heuristics, so it both runs faster than it should and compresses less well than it should
  • it uses high bit depth if ImageMagick is configured for 16-bit channel depth by default, whereas most files processed will be 8 bits deep. Takes longer and compresses worse than it should.

The really hacky part is that it reaches into libpng internals. :) That may or may not be necessary with current APIs, so I’ll do some more poking at it later to see if I can make it work cleaner.

Next steps

I think it’d be useful to have a library that ties into libpng and does just the IDAT chunk, compressing it up parallel-style. It’d use standard ol’ pthreads so you’d have to link that too.

Have to read up a bit more on libpng to see how easy it is to plug in custom image writing “correctly” or if I should “just” redo the entire library. ;) In which case I might do it in rust. :P

Stay tuned for our next post, dear readers, about building and patching GNOME Shell!

Parallelizing PNG compression, part 2: bilingual GNOME Shell

In the first part of our adventure, I regaled you with the tale of slow screenshots on a Linux GNOME desktop with the extremes of a slow-but-multicore CPU and a very high resolution display.

The problem was twofold:

  1. GNOME Shell’s screenshot tool didn’t show audiovisual feedback until after the 7680×2160 image was saved as a PNG file, which was surprisingly slow.
  2. Saving PNG files is single-threaded, wasting 7/8 of available CPU power.

With a solution at hand for each:

  1. Split the screenshot into two asynchronous operations: capture and compression. Show audiovisual feedback after capture and run the effects in parallel with the compression.
  2. Parallelize the filter and compression steps of PNG image writing across multiple threads.

Simply moving the audiovisual feedback earlier in the screenshot operation in GNOME Shell will eliminate the “feel” of the delay, solving most of my specific problem! But PNG writing can totally be parallelized too, and we’ll get to that in later blog posts. :)

GNOME Shell: How Does It Work?

GNOME Shell is a strange beast that takes a central role in the 3.x generation of the GNOME Desktop experience. It serves as a desktop compositor / window manager, a sort of intermediary for drawing all your windows, and it runs the interactive title bars, system menus, taskbar/sidebar, application selector, etc. It’s written in a combination of C using glib’s GObject system and JavaScript. And it can have plugins and stuff.

But the part we care about is its screenshot service, which is what’s triggered when we hit PrintScreen!

This is divided into two parts: a C component which uses the low-level libraries to read a portion of the screen and save it to a PNG, and a JavaScript component which exports a D-bus service wrapping a call to the C component and adding the “camera flash” effect for audiovisual feedback to the user.

Break it down

The C ScreenshotService object’s various methods (for full screen, window, area…) schedule an actual screen capture for the next paint event in the compositor, and then return control to JS, using a GTask to manage the asynchronous return callback.

On the paint event, the pixbuf is captured on the main thread (maybe 0.1s on this case), then a task thread is started to do PNG compression and writing to a file. Main thread continues on, keeping the slow PNG stuff (1.25s in this extreme!) from blocking the UI!

When the file is written out, the task calls back to the main thread and into the JavaScript callback, where it asks the service for the final filename and starts the audiovisual feedback.

Build it back up

For fun, I’ve started on a provisional patch which separates the single capture+compress operation into two separate operations. Now, the JS first calls the appropriate screenshot method to do capture.

When the callback comes back, we’ve got a capture but nothing has been compressed or written to disk — the perfect time to start modifying the screen by starting a visual flash effect! If the capture succeeded, it’s also the time to call a new method to compress & write the previously-captured image to disk.

This seems relatively straightforward to do by untangling and re-tangling some code. Everything’s already wrapped in an asynchronous GTask, and it’s mostly separating out and duplicating and de-duplicating a couple bits.

Patch is in progress, but I haven’t built or tested it yet because I’m still figuring out how to test a custom version of the latest development GNOME Shell on a desktop running a current release OS. :)

And that adventure, dear readers, will be the subject of our next post!

Parallelizing PNG compression, part 1

I’ve noticed that on my Linux workstation (an older CPU with a current graphics card and dual 4K monitors) taking screenshots by pressing “PrintScreen” in the GNOME desktop seems really slow: specifically, there is a long delay of a second or more between tapping the key and the start of the audiovisual “camera flash” feedback.

Profiling with the “perf” tool and checking the actual source for gnome-shell confirmed three things:

  1. gnome-shell doesn’t start the camera flash effect until after the screenshot is saved to disk as a PNG file, meaning the delay is mostly up to the PNG image compression.
  2. PNG compression is slow, and single-threaded! It takes about 1.25s to save a 7680×2160 desktop screenshot PNG on this machine; 0.75s on my faster laptop. A top of the line modern workstation can probably hit 0.5s, but that’s still a longish delay for feedback of a keyboard event.
  3. The two biggest contributors to CPU time are filtering the output pixels before compression (part of libpng), and the actual “deflate” compression (part of zlib).

I’ve divided the problem up into two areas to work on, one of which looks easy and one of which looks tractable but is a little more work to do right:

  1. Patch gnome-shell to split the screenshot provider into separate “capture” and “write” steps, then start the camera flash effect after capture to run in parallel with the compression. On most machines the screenshot will already be compressed before the visual effect finishes, making it seem instantaneous! On corner cases like mine, it’ll still feel fast, but the PNG may not be available until after the flash finishes.
  2. Create a library to write PNGs using multithreading [for the actual filter/compression stages] (either as a helper for libpng, or standalone), and figure out how to get it used in various places. (My screenshot case would be gdk-pixbuf.)

The patch for gnome-shell is mostly written but I haven’t yet figured out how to build and test the latest gnome-shell on Fedora 28. :) Will poke at that in a bit.

For parallelizing the actual compression, I found a number of tools to do multithreaded gzip/deflate wrapping around regular zlib, and one old half-finished experiment at specifically doing so for PNG saving. Learn more about them in our upcoming blog post part 2! (ooh! exciting!)